You are using an outdated browser. Please
upgrade your browser to improve your experience.

This application can be used for the analysis of ratios in general

Analiza - Ratios
by Victor Hidalgo
What is it about?
This application can be used for the analysis of ratios in general. However, in its development and examples we focus on the financial ratios for business analysis.
App Screenshots
App Store Description
This application can be used for the analysis of ratios in general. However, in its development and examples we focus on the financial ratios for business analysis.
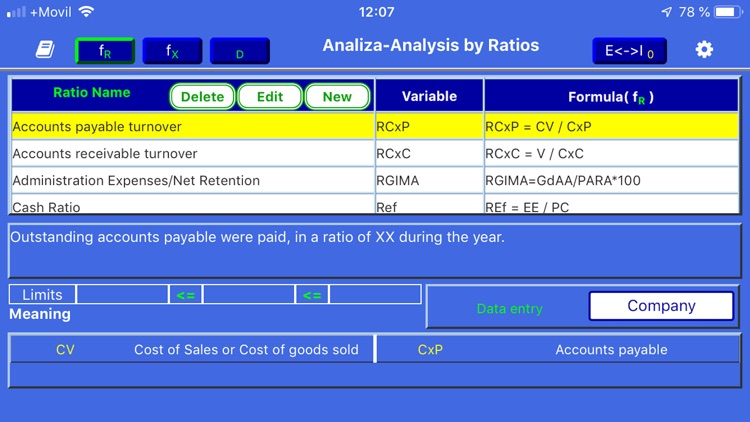
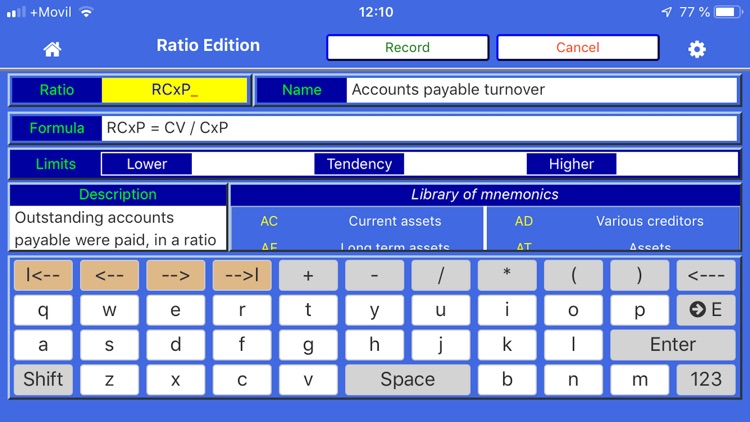
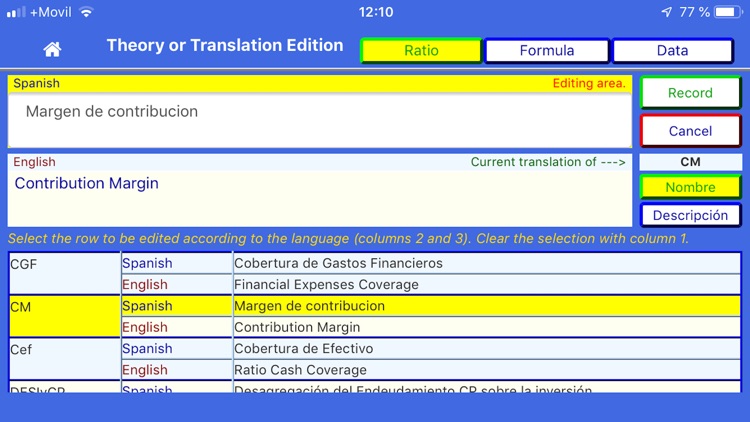
The application allows the analysis of companies through ratios. It presents 53 ratios with the most relevant information and allows the entry or editing of others. The information that is presented can be edited, as well as its translation if it is considered convenient (Spanish - English). Also, it presents 20 formulas and 58 data variables, which can be edited, as well as those that the user could enter.
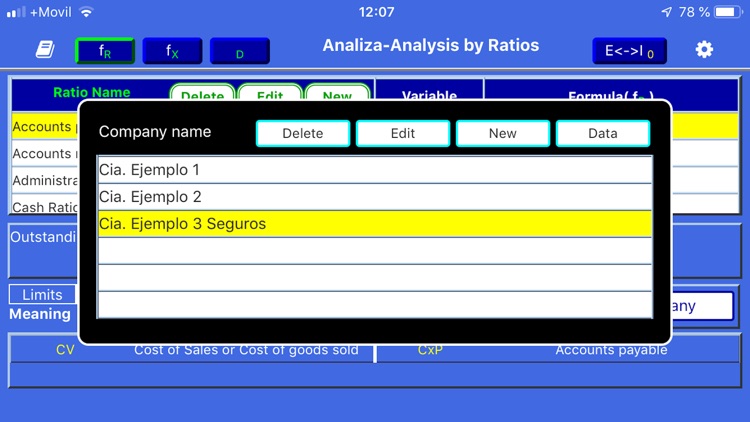
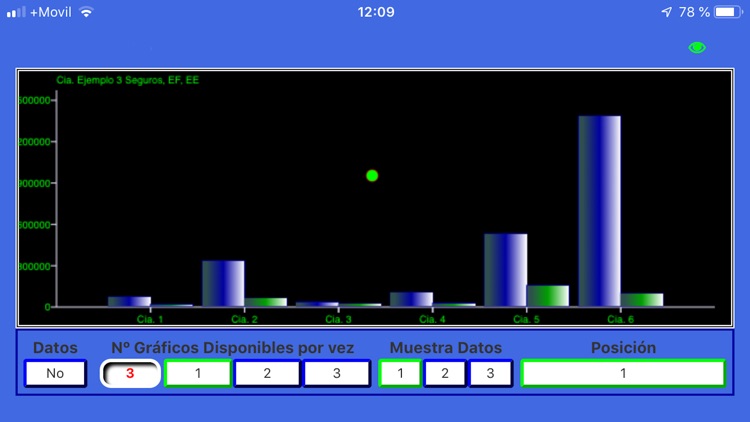
The analysis can be done through ratios, formulas and graphs. To make it easier to understand, three examples of data grouping have been included, also called "companies".
Two levels of information have been considered to identify the referential limits that may be presented by some ratios: numbers and colors. The numbers indicate trends and the colors indicate levels of optimization of result (usually green for the best, red for what is dangerous and amber for what can be considered less transcendent).
Español borrar: se ha considerado dos niveles de información para identificar los limites referenciales que pueden presentar algunos ratios: números y colores. Los números indican tendencias en tanto los colores indican niveles de optimización de resultado.
The data in all cases are editable so that they adjust to what users consider optimal for their analysis.
The application works with three types of data at the formula level: Ratios, Formulas and Data. Ratios and Formulas are both formulas, however formulas are considered to those that consolidate information so that the result can then be used in a Ratio (Example accounting accounts that consolidate).
The data are variables that maintain independent data. The data is the main input to work with formulas and ratios.
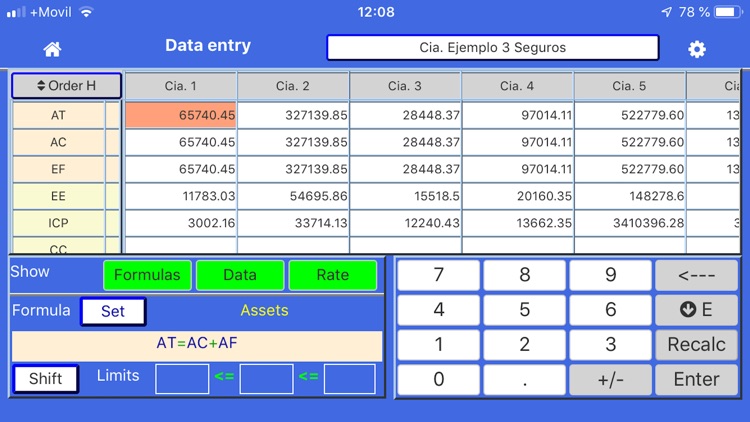
You can create or edit formulas and ratios from scratch. The formulas that are used for each of them have special keyboards to make them easier to work with.
The entry of independent data or the visualization of the result of formulas is done on a screen with the style of a spreadsheet, however, in each case the work cell indicates whether it is possible to edit or enter the data, depending on whether it is located in a result cell or a data entry cell, the latter is indicated in yellow.
The application has an option of automatic calculations that, if it's activated, immediately updates the results of formulas or graphics if they are active. Otherwise, the recalculation button must be pressed.
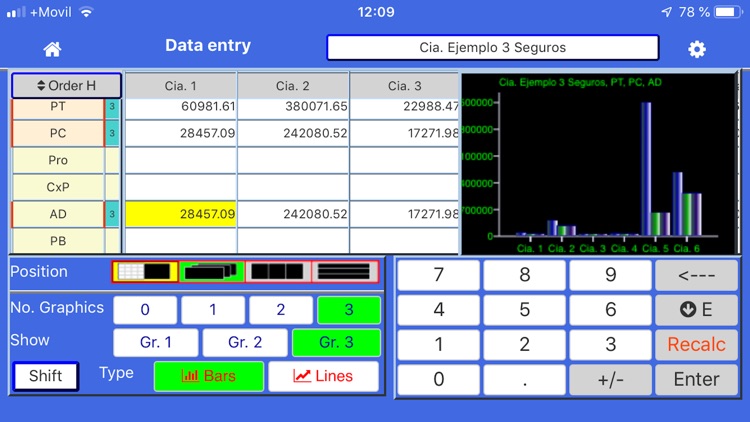
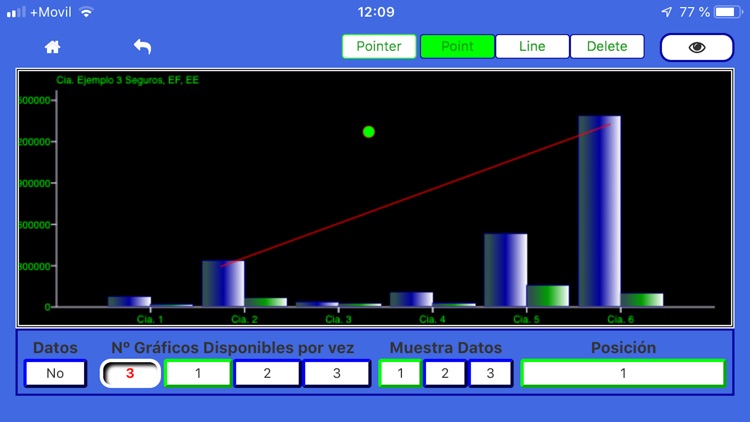
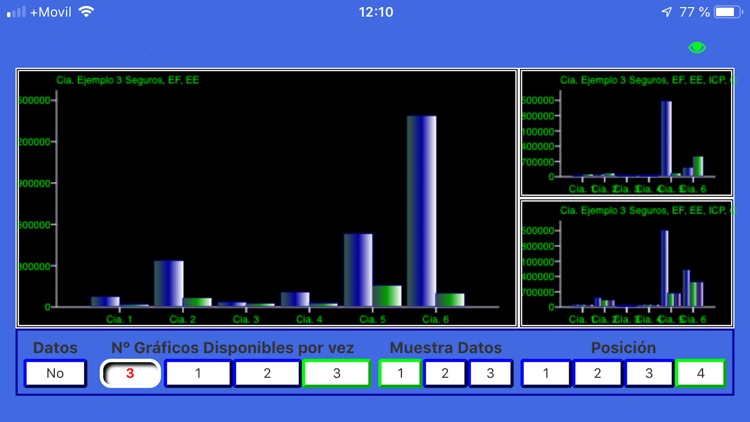
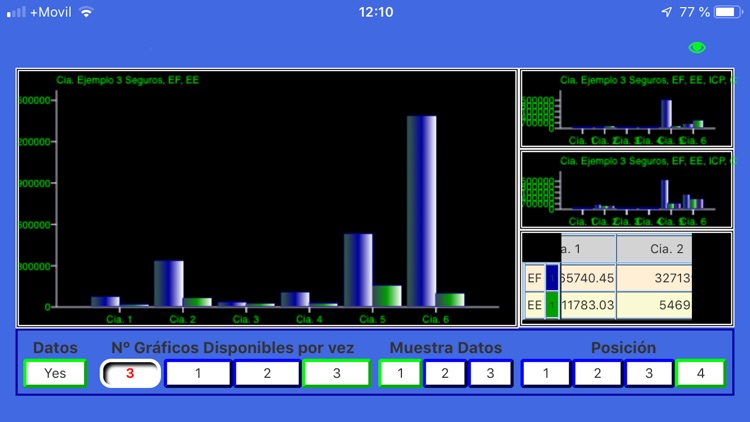
If you have additional devices for screen mirroring, the application allows you to use its information to make presentations. It has a main graph screen that allows you to display up to three graphs on the same screen and also the data you want to expose at the moment. It also has the pointer option, to simulate a laser pointer in the exhibition and, if necessary, has the option to make line strokes.
To perform the analysis of companies or take their evolution is the ideal application. Easy to use and that does not require further learning.
In order to practice the options and have a better understanding, in two of the examples included, the recalculation of the data has not been activated. This is done in the data entry screen with the "recalculation" key.
This is the perfect app to perform the analysis of companies or measure their evolution. Easy to use and that does not require further learning.
In order to practice the options and have a better understanding, in two of the examples included, the recalculation of the data has not been activated. This can be done by pressing the "recalculation" key in the data entry screen.
Disclaimer:
AppAdvice does not own this application and only provides images and links contained in the iTunes Search API, to help our users find the best apps to download. If you are the developer of this app and would like your information removed, please send a request to takedown@appadvice.com and your information will be removed.
AppAdvice does not own this application and only provides images and links contained in the iTunes Search API, to help our users find the best apps to download. If you are the developer of this app and would like your information removed, please send a request to takedown@appadvice.com and your information will be removed.