You are using an outdated browser. Please
upgrade your browser to improve your experience.

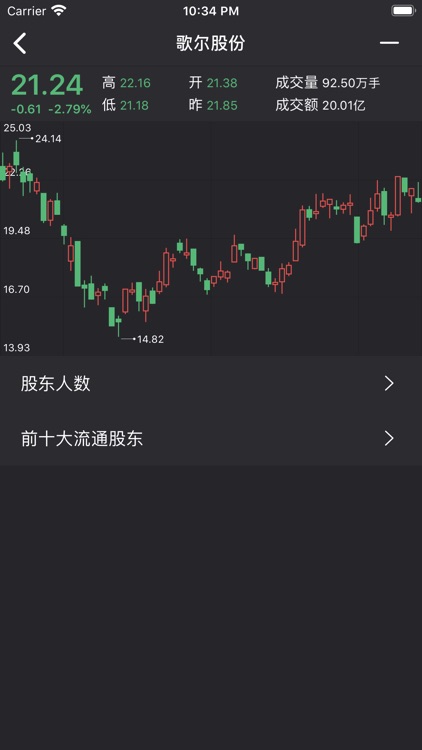
K线图(Candlestick Charts)又称蜡烛图、日本线、阴阳线、棒线等,常用说法是“K线”,起源于日本十八世纪德川幕府时代(1603~1867年)的米市交易,用来计算米价每天的涨跌。因其标画方法具有独到之处,人们把它引入股票市场价格走势的分析中,经过300多年的发展,已经广泛应用于股票、期货、外汇,期权等证券市场。

A股大数据-股票新手入门必备
by SONG XIANG


What is it about?
K线图(Candlestick Charts)又称蜡烛图、日本线、阴阳线、棒线等,常用说法是“K线”,起源于日本十八世纪德川幕府时代(1603~1867年)的米市交易,用来计算米价每天的涨跌。因其标画方法具有独到之处,人们把它引入股票市场价格走势的分析中,经过300多年的发展,已经广泛应用于股票、期货、外汇,期权等证券市场。
App Screenshots
App Store Description
K线图(Candlestick Charts)又称蜡烛图、日本线、阴阳线、棒线等,常用说法是“K线”,起源于日本十八世纪德川幕府时代(1603~1867年)的米市交易,用来计算米价每天的涨跌。因其标画方法具有独到之处,人们把它引入股票市场价格走势的分析中,经过300多年的发展,已经广泛应用于股票、期货、外汇,期权等证券市场。
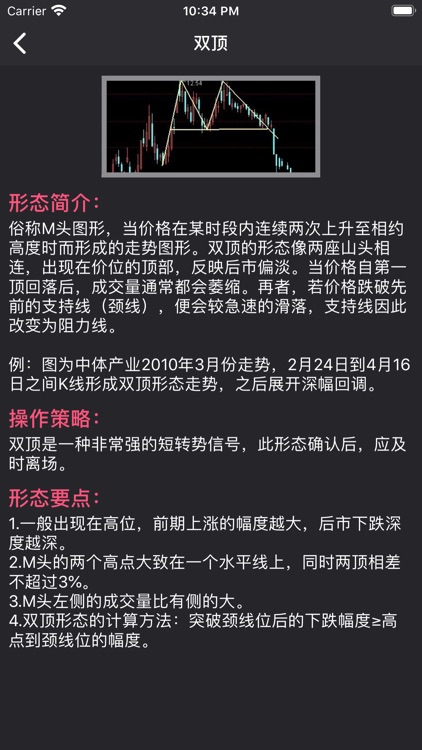
《k线图解》对60种经典K线形态依据图形实例从形态要点、操作策略等多方位进行解析。
Disclaimer:
AppAdvice does not own this application and only provides images and links contained in the iTunes Search API, to help our users find the best apps to download. If you are the developer of this app and would like your information removed, please send a request to takedown@appadvice.com and your information will be removed.
AppAdvice does not own this application and only provides images and links contained in the iTunes Search API, to help our users find the best apps to download. If you are the developer of this app and would like your information removed, please send a request to takedown@appadvice.com and your information will be removed.