You are using an outdated browser. Please
upgrade your browser to improve your experience.
The QC SPC Chart software is an interactive SPC chart (6-sigma) application aimed at quality control professionals (and students) who want to view industry standard statistical quality control charts on their mobile devices

QC SPC Chart Intro Version
by Quinn-Curtis, Inc.
What is it about?
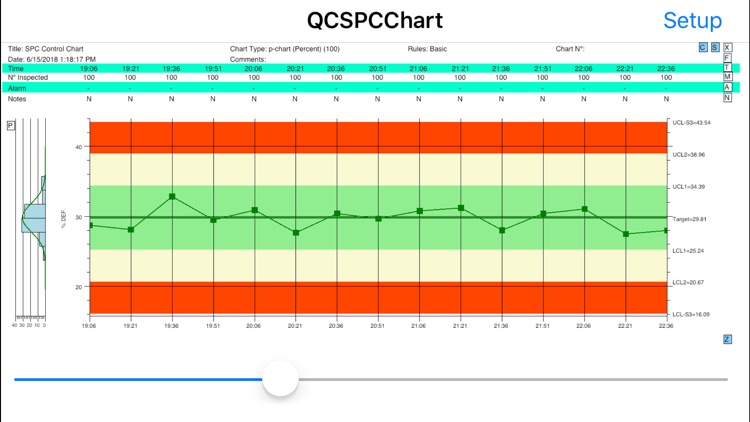
The QC SPC Chart software is an interactive SPC chart (6-sigma) application aimed at quality control professionals (and students) who want to view industry standard statistical quality control charts on their mobile devices. Typical users will monitor critical quality factors in manufacturing, process, and service industries, and display the results in one of the many supported chart types. Chart types include: variable control charts (XBar-R, XBar-Sigma, Individual-Range, and Median-Range), and attribute control charts for monitoring defects (p-, np-, c-, u-, and DPMO charts). The software will automatically calculate SPC control limits using historical data for the supported variable control chart and attribute control chart types. Alarms can be generated for standard +3 sigma control limits, or the WECO (Western Electric) rules. It will also calculate process capability ratios (Cp, Cpk) and process performance indices (Pp, Ppk). A set of specification limits can also be added to the chart.
App Screenshots

App Store Description
The QC SPC Chart software is an interactive SPC chart (6-sigma) application aimed at quality control professionals (and students) who want to view industry standard statistical quality control charts on their mobile devices. Typical users will monitor critical quality factors in manufacturing, process, and service industries, and display the results in one of the many supported chart types. Chart types include: variable control charts (XBar-R, XBar-Sigma, Individual-Range, and Median-Range), and attribute control charts for monitoring defects (p-, np-, c-, u-, and DPMO charts). The software will automatically calculate SPC control limits using historical data for the supported variable control chart and attribute control chart types. Alarms can be generated for standard +3 sigma control limits, or the WECO (Western Electric) rules. It will also calculate process capability ratios (Cp, Cpk) and process performance indices (Pp, Ppk). A set of specification limits can also be added to the chart.
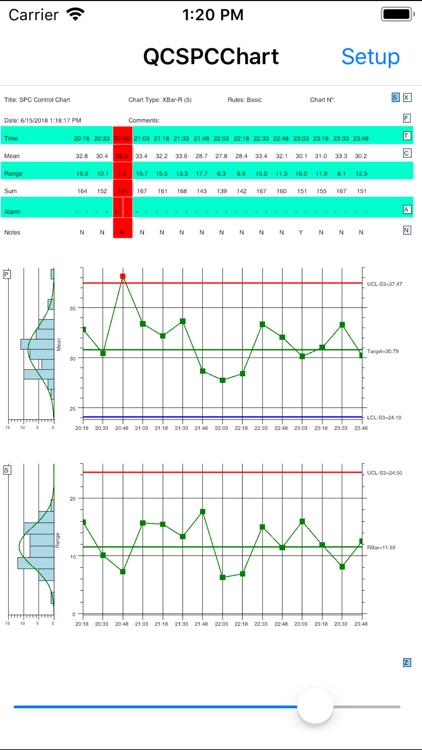
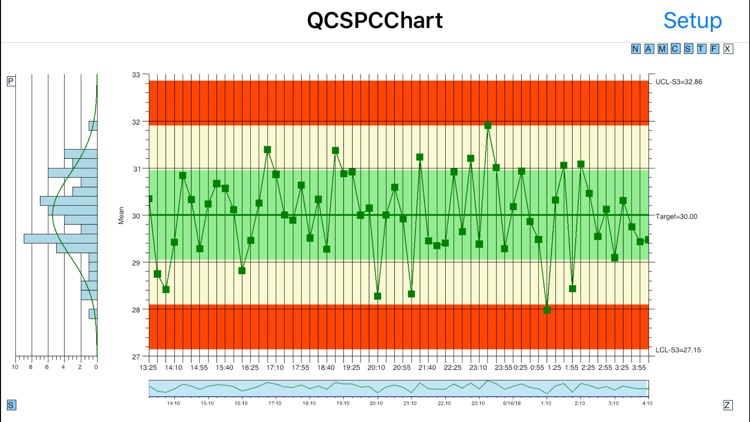
The SPC charts are displayed as one or two synchronized charts, under the control of a scroll bar. The scroll bar can be replaced by an integrated zoom control which allows for the display of charts with a custom time frame. Auto-scaling of the charts y-axes keeps everything in view. An integrated table appears above the chart, that displays information about the process under view, and each sample interval plotted in the chart. The table displays time, individual sample values, sample statistics, process indices, alarm status, and any notes entered for that sample interval.
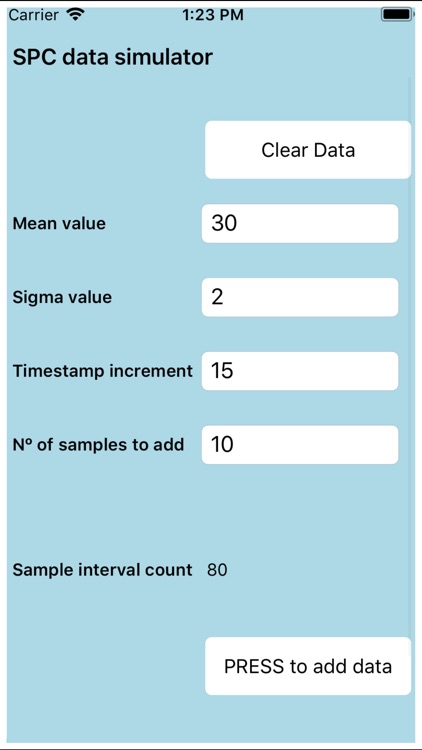
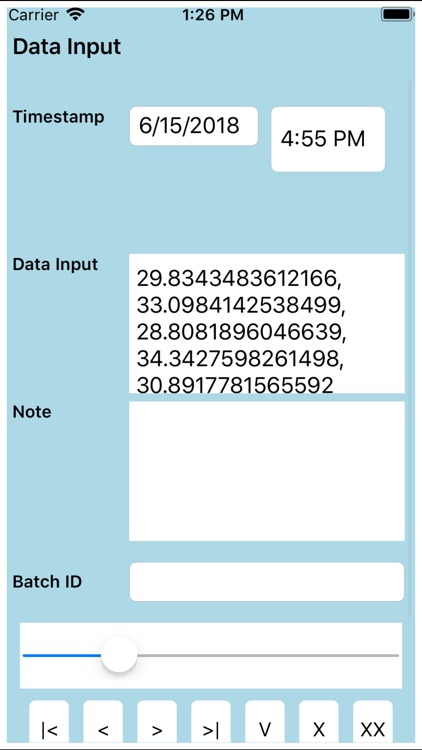
The user can customize the SPC chart and control limits using built-in setup forms. Both auto-calculated and manually set control limits are supported. The user can manually input and edit sample data from within the program. The user can also import sample data from a CSV (comma separated value) file. The entire chart setup, and data, can be saved on the host device so that they are easily accessible the next time you use the app. You can even set the current setup to be auto-loaded the next time the app starts.
The software displays a lot of information on the screen at once, and it is recommended that it be used on devices with a minimum of 1200x800 pixel resolution, landscape or portrait mode.
In the student version of the software the total number of sample intervals (data points) which can be displayed at one time is limited to 100.
Disclaimer:
AppAdvice does not own this application and only provides images and links contained in the iTunes Search API, to help our users find the best apps to download. If you are the developer of this app and would like your information removed, please send a request to takedown@appadvice.com and your information will be removed.
AppAdvice does not own this application and only provides images and links contained in the iTunes Search API, to help our users find the best apps to download. If you are the developer of this app and would like your information removed, please send a request to takedown@appadvice.com and your information will be removed.