You are using an outdated browser. Please
upgrade your browser to improve your experience.

#1 App for Day & Swing Traders

Stock Trader (ms)
by missingSTEP


What is it about?
#1 App for Day & Swing Traders
Stock Trader (ms) is FREE but there are more add-ons
-
$9.99
3 month access
App Screenshots
App Store Description
#1 App for Day & Swing Traders
Stock Trader provides real-time trading signals for selected S&P500 stocks based on a complex mathematical model.
-----------------------------------------------
FEATURES
-----------------------------------------------
- Real-time trading signals **
- Streaming real-time quotes
- Real-time P/L calculation
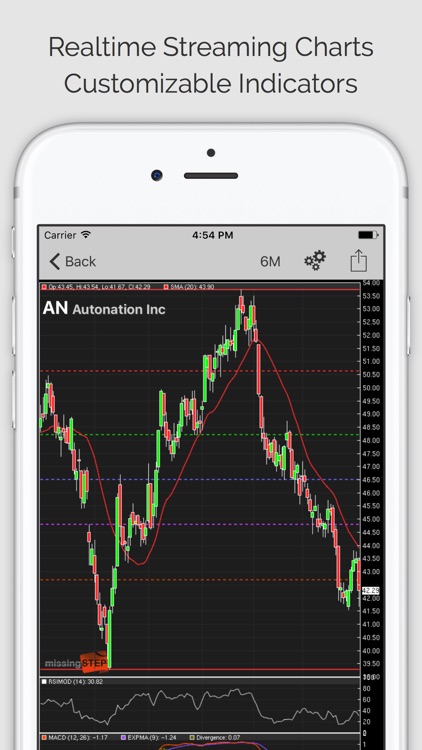
- Real-time charts with customizable technical indicators **
- Auto drawn Fibonacci Retracement lines **
- Fibonacci indicator **
- Macroeconomic news
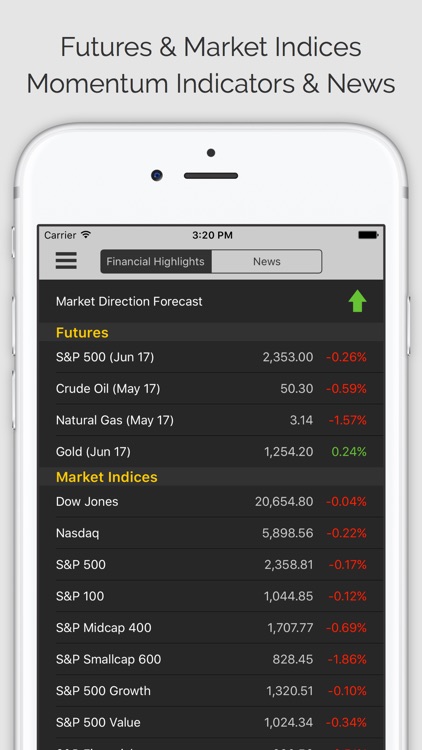
- Market direction forecast
- Futures and market indices
- Watchlist that auto syncs with other devices
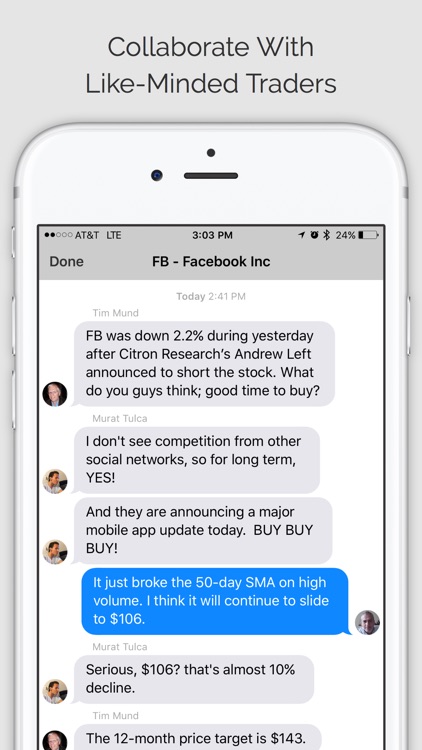
- Discussion pages
- Price alerts
** Free daily access with limited duration (can be extended via in-app purchase)
-----------------------------------------------
HOW DOES IT WORK?
-----------------------------------------------
Volatility of a stock is composed of firm-specific risk, plus market risk. In equity markets, the market risk or the systematic risk dominates short term trading patterns of most equities. EMI Ltd has developed a trading strategy to exploit this characteristic. Also described as “mean reversion”, this strategy examines historical data of selected S&P500 stocks and constructs correlation/dispersion and volatility maps. The model continuously checks real-time prices and compares them to these maps by using various algorithms. If the price of a stock falls below its character map, it generates a buy signal. If on the other hand the price goes above its character map, the tool generates a sell signal. As these anomalies occur, short term (typically 5-7 days) trading and significant profit opportunities arise.
-----------------------------------------------
WHO CAN USE STOCK TRADER?
-----------------------------------------------
Since Stock Trader identifies short-term investment opportunities and price patterns, this tool is ideal for investors who check their portfolios at minimum on a daily basis and frequent traders with holding periods ranging from 3 to 7 days. However, investors with much longer holding periods (up to 2-3 months) and even day-traders following intraday swings and/or momentum can easily use Stock Trader to discover profitable ideas.
Disclaimer:
AppAdvice does not own this application and only provides images and links contained in the iTunes Search API, to help our users find the best apps to download. If you are the developer of this app and would like your information removed, please send a request to takedown@appadvice.com and your information will be removed.
AppAdvice does not own this application and only provides images and links contained in the iTunes Search API, to help our users find the best apps to download. If you are the developer of this app and would like your information removed, please send a request to takedown@appadvice.com and your information will be removed.