You are using an outdated browser. Please
upgrade your browser to improve your experience.
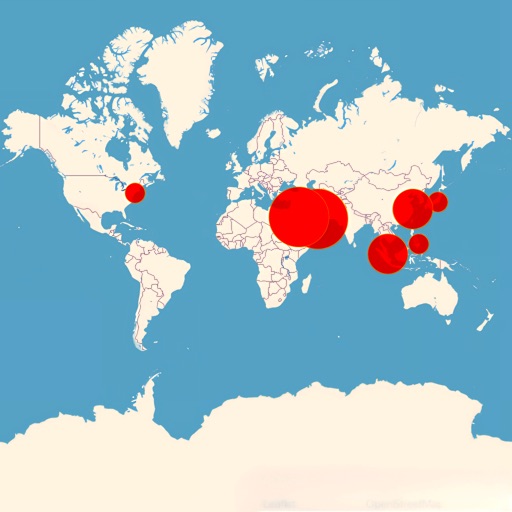
Easily create compelling geographic bubble maps on iPhone, iPad and Mac, visualizing the magnitude of data by bubble size for different geographic locations

BubbleMapMaster
by 辉章 何


What is it about?
Easily create compelling geographic bubble maps on iPhone, iPad and Mac, visualizing the magnitude of data by bubble size for different geographic locations!
App Store Description
Easily create compelling geographic bubble maps on iPhone, iPad and Mac, visualizing the magnitude of data by bubble size for different geographic locations!
Key Features:
Geo-data mapping: Display data on a world map or a map of a specific region
Bubble Size Representation: Visualize the magnitude of data using bubble size
Interactive Zooming: Drill down from a global view to a specific country or region
Real-time updates: Bubbles on the map automatically resize as data changes
High-definition export: Supports multiple formats for perfect rendering in reports and presentations
Cross-platform synchronization: work seamlessly across all devices
Applicable Scenarios:
Global market analysis: show sales in different countries
Demographic research: visualize population density by region
Comparison of Economic Indicators: Compare GDP or foreign direct investment across countries.
Disease Spread Tracking: Visualize the number of people infected by outbreaks in each region
Natural Resource Distribution: visualize mineral reserves or forest cover by region
Portfolio analysis: visualize the amount of investments in different regions
Tourism analysis: visualize the number of tourists or tourism revenues by region
Comparison of Energy Consumption: compares the total amount of energy used by each country
Distribution of educational resources: visualize the number of students or educational expenses in each region
Environmental Impact Assessment: Visualize carbon emissions or renewable energy production by region.
Why choose BubbleMapMaster?
User-friendly: no professional skills required, everyone can become a data visualization expert
Save time: quickly create, edit and share your bubble maps
Professional presentation: make your reports and presentations more convincing
Data-driven: help you make smarter business decisions
Download BubbleMapMaster today and start your geographic data visualization journey! Whether you're a market analyst, demographer, economist, or policy maker, BubbleMapMaster helps you visualize geographically relevant data distributions.
Problems? Our support team is at your service!
Disclaimer:
AppAdvice does not own this application and only provides images and links contained in the iTunes Search API, to help our users find the best apps to download. If you are the developer of this app and would like your information removed, please send a request to takedown@appadvice.com and your information will be removed.
AppAdvice does not own this application and only provides images and links contained in the iTunes Search API, to help our users find the best apps to download. If you are the developer of this app and would like your information removed, please send a request to takedown@appadvice.com and your information will be removed.