You are using an outdated browser. Please
upgrade your browser to improve your experience.
The Cauchy distribution is a continuous probability distribution

Cauchy Distribution Function
by Donald Schaefer


Cauchy Distribution Function Offers Apple Watch App
Check the details on WatchAware
Check the details on WatchAware
What is it about?
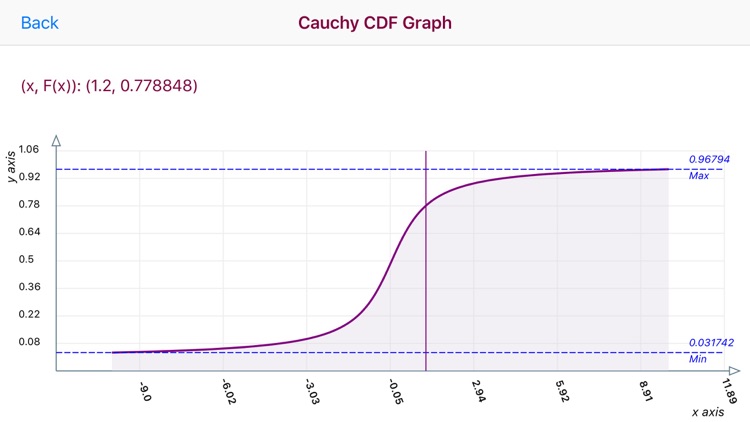
The Cauchy distribution is a continuous probability distribution. Its cumulative distribution function has the shape of an arctangent function arctan(x).
App Screenshots


App Store Description
The Cauchy distribution is a continuous probability distribution. Its cumulative distribution function has the shape of an arctangent function arctan(x).
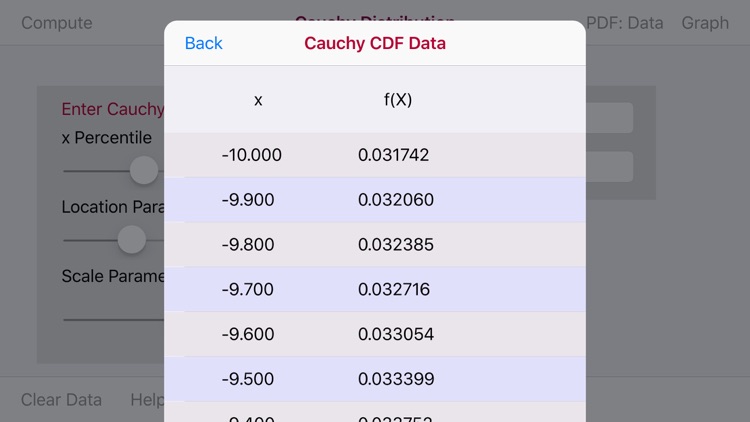
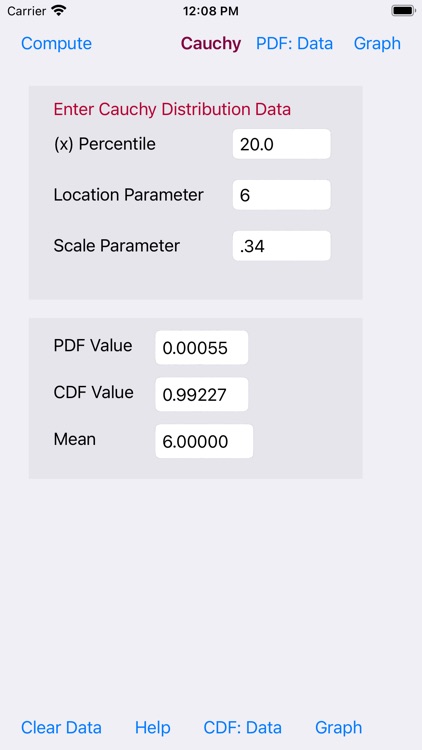
The Cauchy Distribution Function Calculator utilizes data input via three sliders for the Percentile (x) Parameter, the Location Parameter and the Shape Parameter.
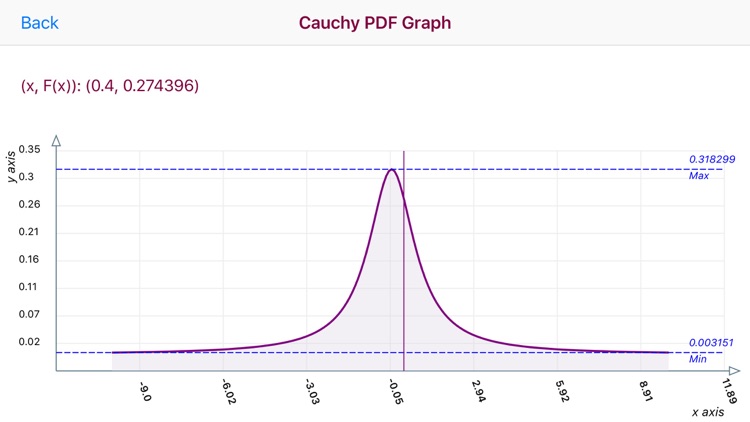
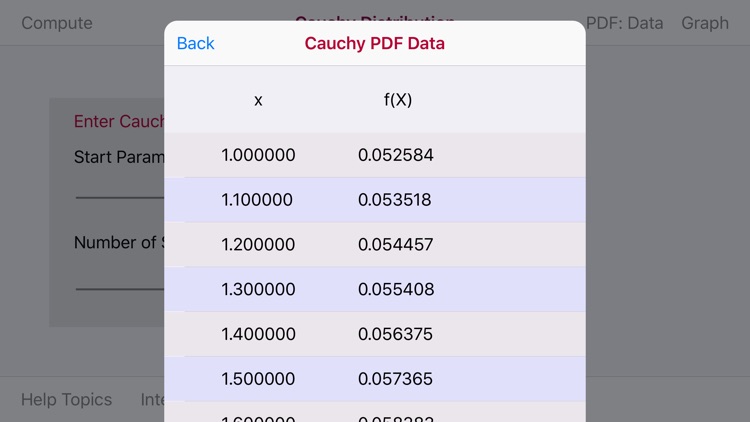
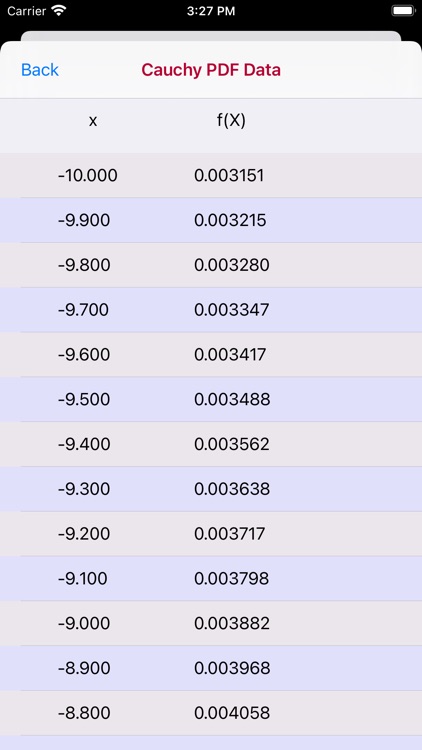
The Cauchy Distribution App computes PDF/CDF data tables and graphs. The data pairs have a range of -10.0 to 10.0 for 200 data pair points with an increment value of 0.1.
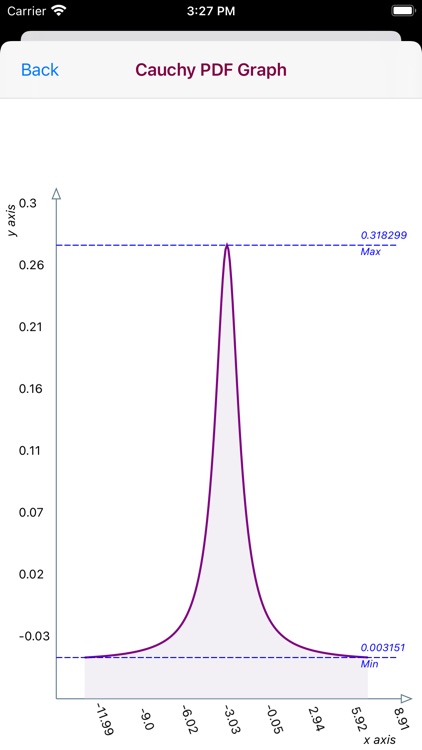
The Cauchy App graphs are touch enabled. Upon touching the graph a vertical line appears. Move the vertical line to the left or right to display the point (x/f(x)) data in the upper left of the graph.
The horizontal x-axis displays x values. The vertical y-axis plots a range of F(x) values.
Horizontal Max and Min dashed line display the Maximum and Minimum F(x) values
Disclaimer:
AppAdvice does not own this application and only provides images and links contained in the iTunes Search API, to help our users find the best apps to download. If you are the developer of this app and would like your information removed, please send a request to takedown@appadvice.com and your information will be removed.
AppAdvice does not own this application and only provides images and links contained in the iTunes Search API, to help our users find the best apps to download. If you are the developer of this app and would like your information removed, please send a request to takedown@appadvice.com and your information will be removed.