You are using an outdated browser. Please
upgrade your browser to improve your experience.

In probability theory, a log-normal (or lognormal) distribution is a continuous probability distribution of a random variable whose logarithm is normally distributed

Lognormal Distribution
by Donald Schaefer

Lognormal Distribution Offers Apple Watch App
Check the details on WatchAware
Check the details on WatchAware
What is it about?
In probability theory, a log-normal (or lognormal) distribution is a continuous probability distribution of a random variable whose logarithm is normally distributed. Thus, if the random variable Y is log-normally distributed, then ln(X) has a normal distribution. Likewise, if Y has a normal distribution, then X = exp(Y) has a log-normal distribution.
App Screenshots


App Store Description
In probability theory, a log-normal (or lognormal) distribution is a continuous probability distribution of a random variable whose logarithm is normally distributed. Thus, if the random variable Y is log-normally distributed, then ln(X) has a normal distribution. Likewise, if Y has a normal distribution, then X = exp(Y) has a log-normal distribution.
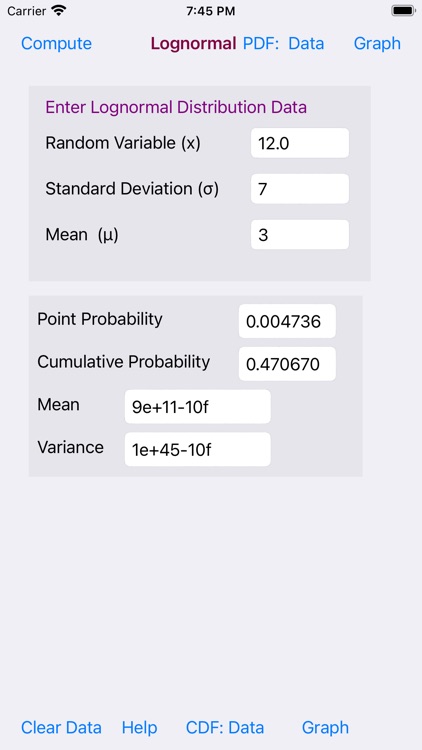
For Data Entry the Laplace Distribution app utilizes three Sliders.
The First Slider enters the Random Variable (x). The range of the Random Variable (x) is 1.0 to 12.0.
The Second Slider enters the Standard Deviation (σ) value. The range of the Standard Deviation is 1.0 to 4.0
The Third Slider enters the Standard Mean (μ) value. The range of the Standard Deviation is 1.0 to 8.0.
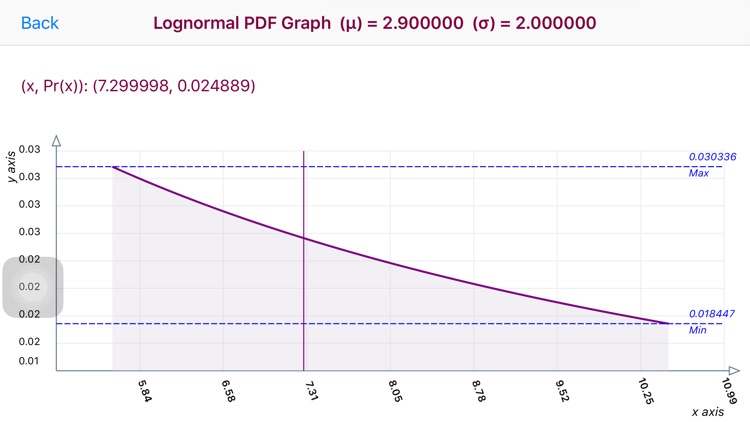
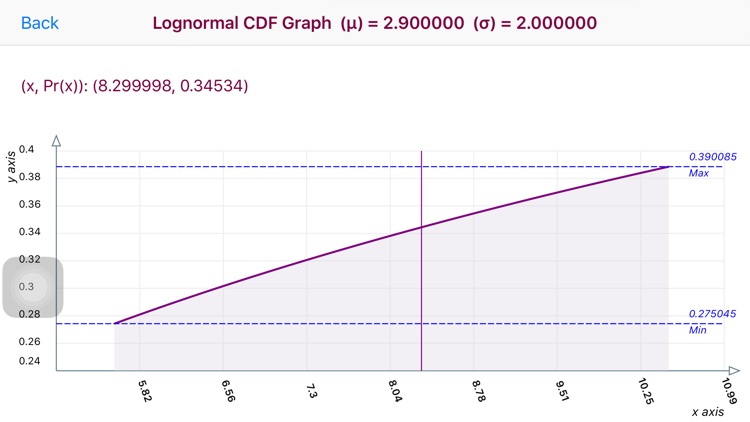
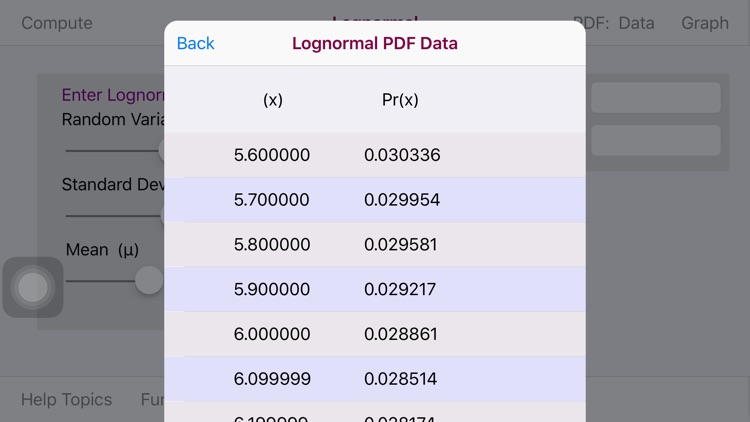
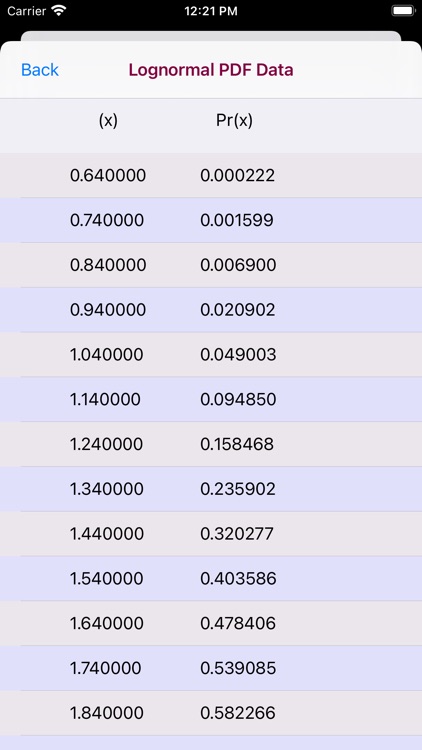
The Lognormal PDF graph displays (x/Pr(x)) data pairs. The graph is a touch enabled graph. Upon touching the graph a vertical line appears. Move the vertical line to the left or right to display the point (x/Pr(x)) data in the upper left of the graph.
The horizontal x-axis displays x values. The vertical y-axis plots a range of Pr(x) values.
Horizontal Max and Min dashed lines display the Maximum and Minimum Pr(x) values
Disclaimer:
AppAdvice does not own this application and only provides images and links contained in the iTunes Search API, to help our users find the best apps to download. If you are the developer of this app and would like your information removed, please send a request to takedown@appadvice.com and your information will be removed.
AppAdvice does not own this application and only provides images and links contained in the iTunes Search API, to help our users find the best apps to download. If you are the developer of this app and would like your information removed, please send a request to takedown@appadvice.com and your information will be removed.