You are using an outdated browser. Please
upgrade your browser to improve your experience.

Monitor your server resource usage with Prometheus Metrics Reader

Prometheus Metrics Reader
by Igor Kolpin

What is it about?
Monitor your server resource usage with Prometheus Metrics Reader.
App Screenshots
App Store Description
Monitor your server resource usage with Prometheus Metrics Reader.
For the application to work, you need to install Prometheus on your server. Download link - https://prometheus.io/download/
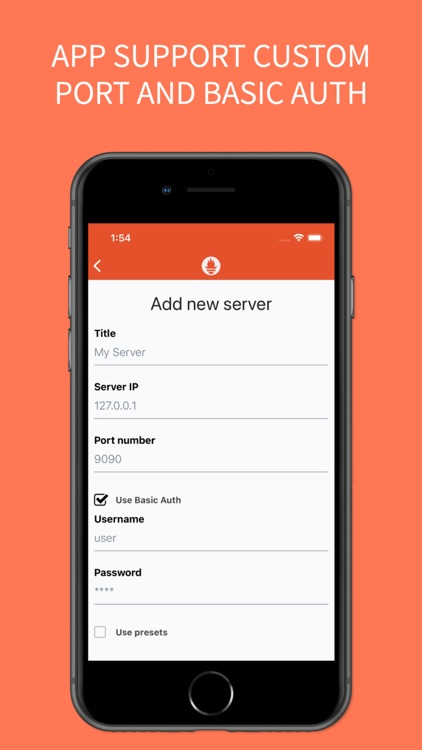
- The app supports adding multiple servers.
- You can use the custom server port and Basic Auth.
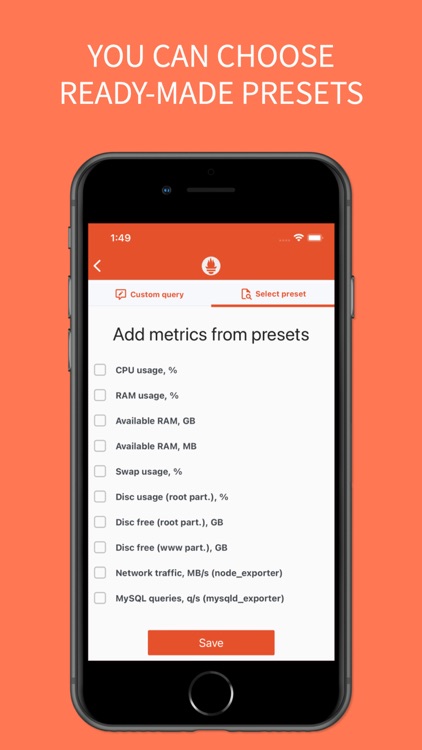
- You can use ready-made presets.
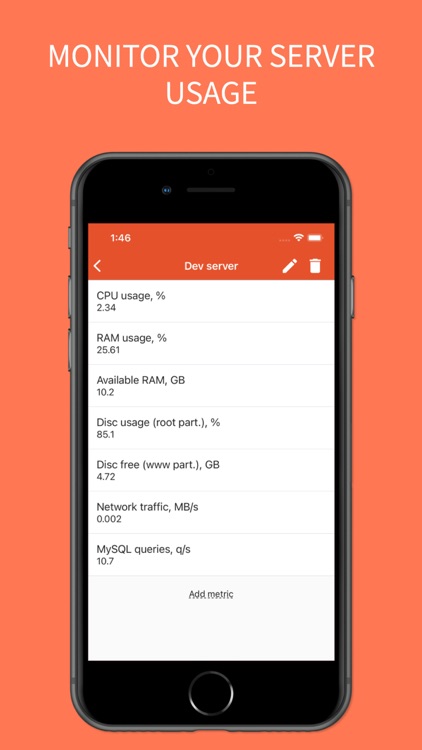
- You can add your custom metrics or edit presets.
- Metrics are updated automatically when the server screen is open.
You can write any query using Prometheus Queries API - https://prometheus.io/docs/prometheus/latest/querying/basics/
At the moment, the application only supports single values. Graphs and multiple values are not supported.
Disclaimer:
AppAdvice does not own this application and only provides images and links contained in the iTunes Search API, to help our users find the best apps to download. If you are the developer of this app and would like your information removed, please send a request to takedown@appadvice.com and your information will be removed.
AppAdvice does not own this application and only provides images and links contained in the iTunes Search API, to help our users find the best apps to download. If you are the developer of this app and would like your information removed, please send a request to takedown@appadvice.com and your information will be removed.