You are using an outdated browser. Please
upgrade your browser to improve your experience.

Welcome to Stock+, where your financial aspirations take flight

Stock Map, Heatmap by Stock+
by Kemal Bakacak

What is it about?
Welcome to Stock+, where your financial aspirations take flight. The most popular stock indexes are in your fingers. Explore the stocks sector by sector with interactive visualized map. Look at S&P500, Dow Jones and Nasdaq 100 stock map (heat map, treemap). Whether you're a seasoned investor or just starting on your financial journey, Stock+ is your trusted partner in building a secure and prosperous future.
App Screenshots


App Store Description
Welcome to Stock+, where your financial aspirations take flight. The most popular stock indexes are in your fingers. Explore the stocks sector by sector with interactive visualized map. Look at S&P500, Dow Jones and Nasdaq 100 stock map (heat map, treemap). Whether you're a seasoned investor or just starting on your financial journey, Stock+ is your trusted partner in building a secure and prosperous future.
Features,
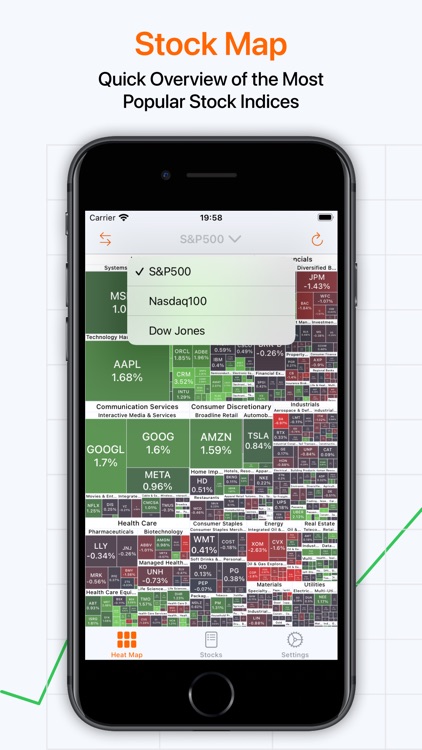
- Interactive Stock Map
Easily understand with color-coded according to daily results.
- Deepdive Sector Stocks
Lots of stock in a screen. Click to any sector and new map will draw with that sector stocks. Easy to use and more understandable especially in large number of stock based indexes like S&P 500.
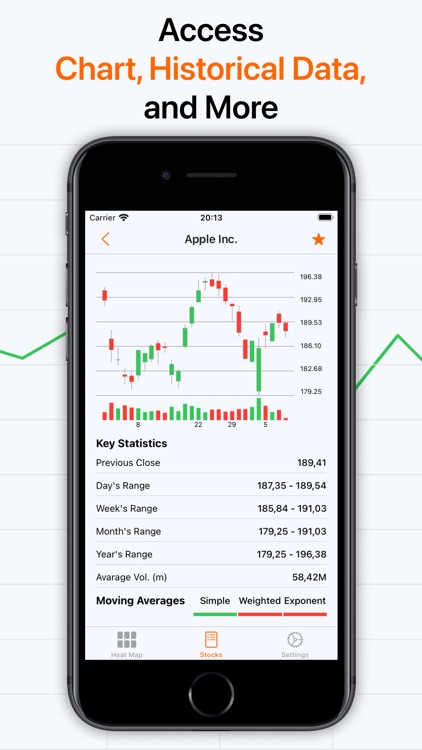
- Stock Detail
Choose the whatever you want stock and get more price information like well-designed candlestick graphic, daily, weekly, monthly, yearly minimum and maximum price movements.
- Favorite Stocks
Add all of your favorite stocks to list and you can easily access with them. The new list will start with your favorite stocks.
- Reliable and Secure
Your privacy and security are our utmost priority. All of your datas are keeping in your phone. We don't have any information about your personal data.
- User-Friendly Interface
Navigate the complexities of investing with ease. Our intuitive interface ensures that you can monitor your investments, track performance, and make informed decisions—all from the palm of your hand.
- Technical Analysis
Follow simple, weighted, exponential daily moving averages in 5, 10, 20, 50, 100, 200 day periods.
- Technical Indicators
Also follow best resulted indicators like RSI, MACD, STOCH, CCI, STOCHRSI, ATR, ADX, OU, ROC, WilliamsR and get easily signals.
How to Work?
The stocks on a map are grouped in hierarchies. A market contains multiple sectors. A sector contains multiple industries. An industry contains multiple stocks.
For example, S&P500 index has 11 sectors (Utilities, Real Estate, Materials, Information Technology, Industrials, Health Care, Financials, Energy, Consumer Staples, Consumer Discretionary, Communication Services). All of sectors can have lots of different industries. Utilities is one of sectors and has 5 different industries (Independent Power Producers & Energy Traders, Electric Utilities, Multi-Utilities, Water Utilities, Gas Utilities). Each utilies has one or more stock.
On the other hand, different indexes has different rules. Dow Jones does not have sectors. It is only divided by industries. It contains 17 different industries (Telecommunications industry, Semiconductor industry, Retailing, Pharmaceutical industry, Petroleum industry, Managed health care, Insurance, Home Improvement, Food industry, Fast-moving consumer goods, Drink industry, Construction, Conglomerate, Clothing industry, Chemical industry, Broadcasting, Biopharmaceutical, Aerospace). Like others, each industries has one or more stock.
Stock Map visualizes the stock market with a market heat map (a.k.a. market treemap). The size of a block is determined by the market cap of that company. And the whole map is sorted by the market cap in descending order.
Subscription and Pricing:
If you choose to purchase, payment will be charged to your iTunes account, and your account will be charged for renewal within 24-hours prior to the end of the current period. Auto-renewal may be turned off at any time by going to your settings in the iTunes Store after purchase. Any unused portion of a free trial period, if offered, will be forfeited when the user purchases a subscription to that publication, where applicable
Current subscription starts from $2.99 USD/month.
Subscriptions can be deactivated at the following link: https://support.apple.com/en-us/HT202039
Privacy Policy: https://kemalbakacak.com/agreements/stock-plus-stock-map-heatmap/privacy_policy.html
Terms of Use: https://kemalbakacak.com/agreements/stock-plus-stock-map-heatmap/terms_and_conditions.html
Disclaimer:
AppAdvice does not own this application and only provides images and links contained in the iTunes Search API, to help our users find the best apps to download. If you are the developer of this app and would like your information removed, please send a request to takedown@appadvice.com and your information will be removed.
AppAdvice does not own this application and only provides images and links contained in the iTunes Search API, to help our users find the best apps to download. If you are the developer of this app and would like your information removed, please send a request to takedown@appadvice.com and your information will be removed.