You are using an outdated browser. Please
upgrade your browser to improve your experience.

UtilMatS is a statistical calculator that includes graphics and the ease of use of the calculators available in the market

UtilMatS
by Victor Hidalgo


What is it about?
UtilMatS is a statistical calculator that includes graphics and the ease of use of the calculators available in the market. Ideal for professionals and students. Performs standard, scientific and descriptive statistics calculations.
App Screenshots


App Store Description
UtilMatS is a statistical calculator that includes graphics and the ease of use of the calculators available in the market. Ideal for professionals and students. Performs standard, scientific and descriptive statistics calculations.
It includes a view of the calculations performed and at the same time it works as an endless memory in which you can select both numbers entered, and the results obtained. In addition, it presents the ability to perform interpolation calculations; rules of three simple direct or inverse; and in statistics of mode, median, arithmetic average, mean deviation, variance, standard deviation and coefficient of variation. The formulas used remain displayed on the screen for reference.
Functions
- Basic calculation buttons
- Scientific calculation buttons
- Buttons for statistical calculations of discrete and grouped data.
- Mode, Median, Arithmetic mean, Mean deviation, Variance, Standard deviation and Coefficient of variation buttons.
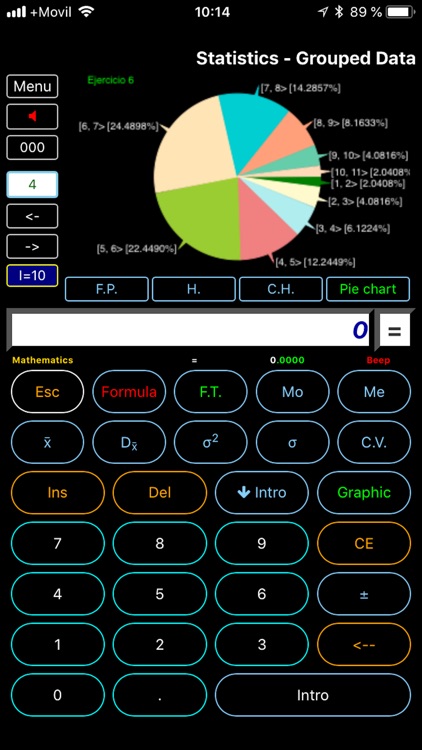
- Graphics button applicable to Mode, Median, arithmetic average, Mean deviation and Standard deviation, making it easy to visual analysis.
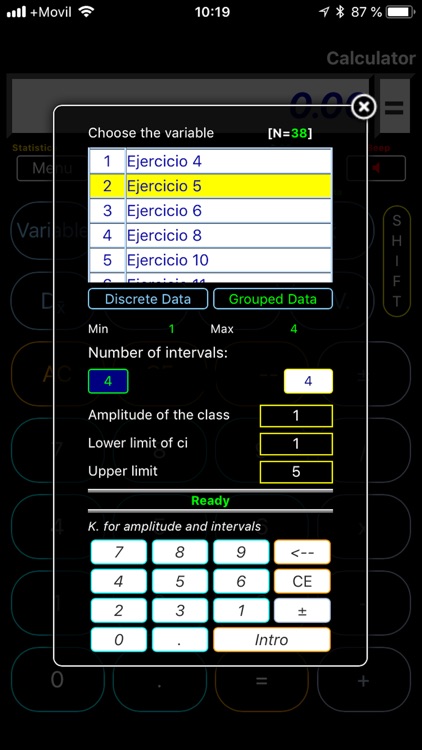
- Button for entering data by keyboard or importing data in CSV format
- For statistical calculations in calculations grouped by intervals allows the modification of the number of intervals, the lower and upper limit, as well as the amplitude of the interval, with alerts in the case of using these functions through the calculations screen.
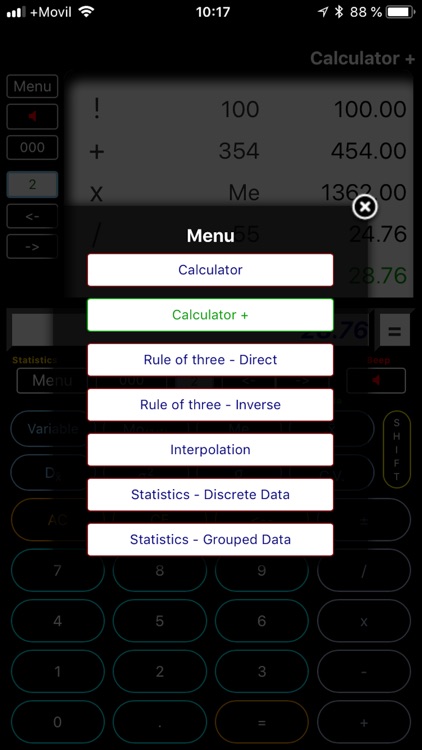
- A convenient Menu button, which allows you to scroll through the options of: Normal Calculator, Calculator with the visualization of calculations made and which is also used as memory of damages and results, Rule of three simple, Rule of three inverse interpolation, statistics for income and work with discrete data, and statistics for income and work with grouped data. These last two options present the possibility of visualization of graphs.
- Frequency table button.
- Set the thousands separator with a single button
- Set the decimals quantities to be displayed on the calculator
- Normal percentages functions as well as adding and deducting percentages
- Button to erase only one digit: slide the result screen or use the back button
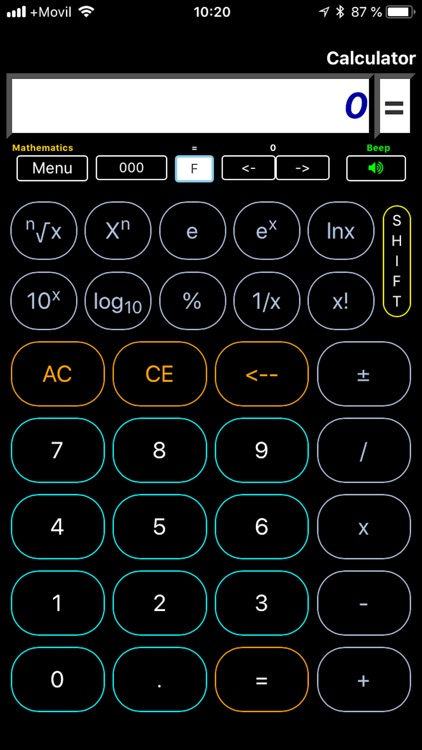
- Standard calculator type screen
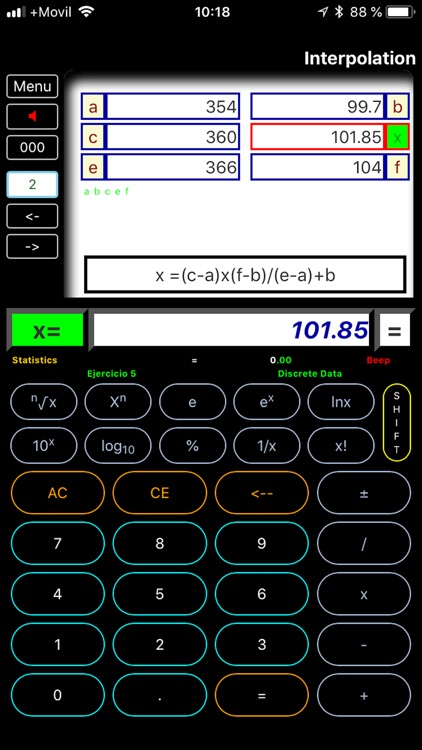
- Calculation screen to visualize operations carried out and formulas used in cases of interpolation and simple three rule.
- Keyboard sound activation available.
- Storage of up to 100 variables in a database
LIST OF MATHEMATICAL OPERATIONS
- Addition, subtraction, division, multiplication
- Percentages:
Number x Number of the percentage % = results
Number + Number of the percentage % = number increased in the percentage
Number - Number of the percentage % = number deducted in the percentage
- Nth exponent and nth root
- Power of e, power of ten
- Neperian and decimal logarithm
- Inverse and factorial function
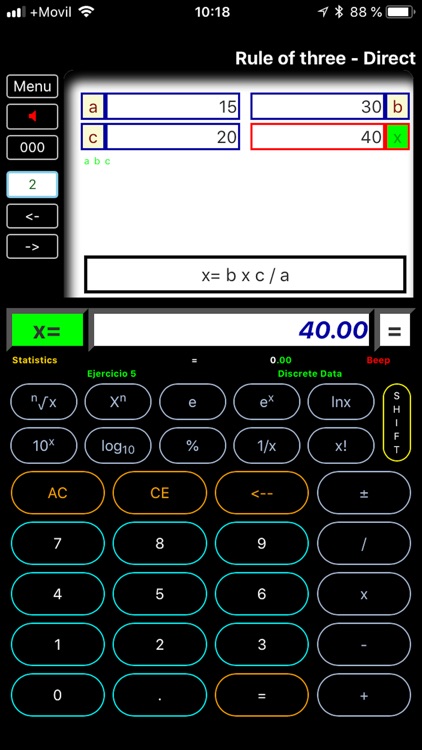
- Rule of three - Direct
- Rule of trhee - Inverse
- Interpolation
LIST OF STATISTICAL FUNCTIONS
- Mode (discrete and grouped data and by intervals, graphics).
It allows to show results and visualize the graphics for the type of Mode (Multiple mode if there are)
- Median (discrete and grouped data and by intervals, graphics).
- Arithmetic mean (discrete and grouped data and by intervals, graphics).
- Deviation from media (discrete and grouped data and by intervals, graphics).
- Variance (Discrete and grouped data and Intervals).
- Standard deviation (discrete and grouped data and by intervals, graphics).
- Coefficient of variation (discrete and grouped data and by intervals).
LIST OF AVAILABLE FORMULAS
- The formulas and indications allow to remember or reinforce a learning for help in the analysis and interpretation of the data.
- Simple three rule
- Three inverse rule
- Interpolation
- Mode
- Median
- Arithmetic mean
- Deviation from media
- Variance
- Standard deviation
- Coefficient of variation.
Disclaimer:
AppAdvice does not own this application and only provides images and links contained in the iTunes Search API, to help our users find the best apps to download. If you are the developer of this app and would like your information removed, please send a request to takedown@appadvice.com and your information will be removed.
AppAdvice does not own this application and only provides images and links contained in the iTunes Search API, to help our users find the best apps to download. If you are the developer of this app and would like your information removed, please send a request to takedown@appadvice.com and your information will be removed.