You are using an outdated browser. Please
upgrade your browser to improve your experience.
In probability and statistics, the Weibull distribution is a continuous 3 factor probability distribution

Weibull Distribution
by Donald Schaefer


Weibull Distribution Offers Apple Watch App
Check the details on WatchAware
Check the details on WatchAware
What is it about?
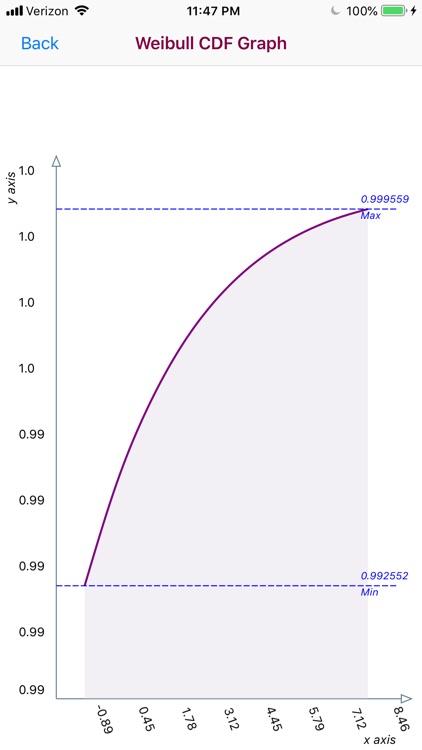
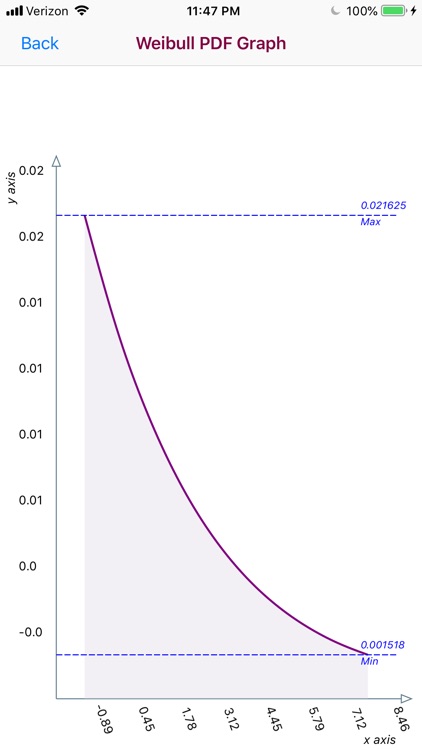
In probability and statistics, the Weibull distribution is a continuous 3 factor probability distribution.
App Screenshots


App Store Description
In probability and statistics, the Weibull distribution is a continuous 3 factor probability distribution.
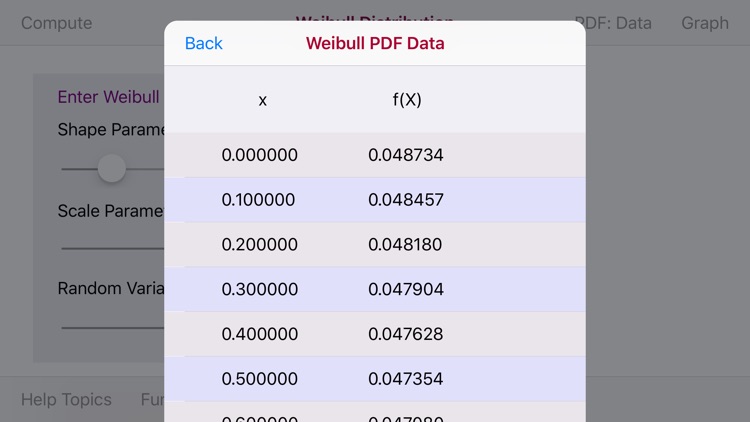
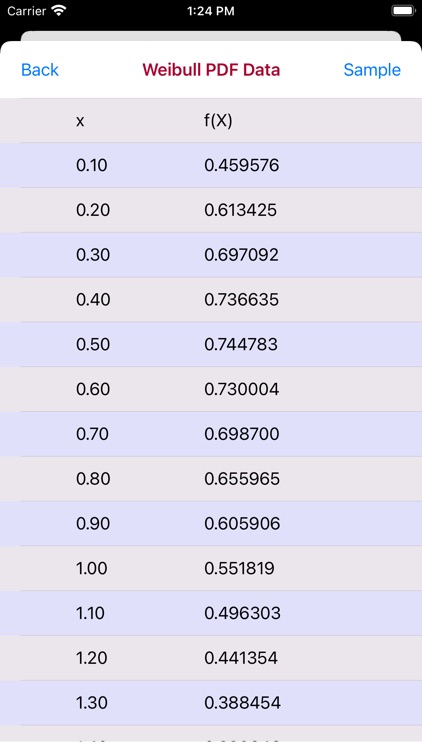
The three factors that comprise the Weibull distribution are the Shape Parameter (a), the Scale Parameter ( b) and data sets of a Random Variable (x).
The Weibull distribution probability density function is used in predicting the time to failure. It is often applied in manufacturing and materials science.
For Data Entry the Weibull Distribution app for iPad and iPhone utilizes three Sliders to enter the Shape Parameter (a), the Scale Parameter (b) and a Random Variable (x). . The range of the Shape Parameter (a) and Scale Parameter (b) is [1-4] with 0.1 segments. The range of the Random Variable (x) is [1-4] also divided into 0.1 segments.
The Weibull Distribution app graphs the Weibull Proability Density Function f(x) graph for the two entered Shape Paramter (a), the Scale Parament (b) and for a family of 11 Random Variable (x) values for the range [1-4]. A unique graph will be displayed for each unique Shape Parameter (a) and Scale Parameter (b) pair.. A Data Table displays the x/f(x) values for a Random Variable (x) range.
Disclaimer:
AppAdvice does not own this application and only provides images and links contained in the iTunes Search API, to help our users find the best apps to download. If you are the developer of this app and would like your information removed, please send a request to takedown@appadvice.com and your information will be removed.
AppAdvice does not own this application and only provides images and links contained in the iTunes Search API, to help our users find the best apps to download. If you are the developer of this app and would like your information removed, please send a request to takedown@appadvice.com and your information will be removed.