You are using an outdated browser. Please
upgrade your browser to improve your experience.

Zeptive vape detection systems application for monitoring and control

Zeptive
by Zeptive, Inc.


What is it about?
Zeptive vape detection systems application for monitoring and control.
App Screenshots

App Store Description
Zeptive vape detection systems application for monitoring and control.
The VapeAlert application allows users to see the status, data, and settings for vape detectors deployed in the field.
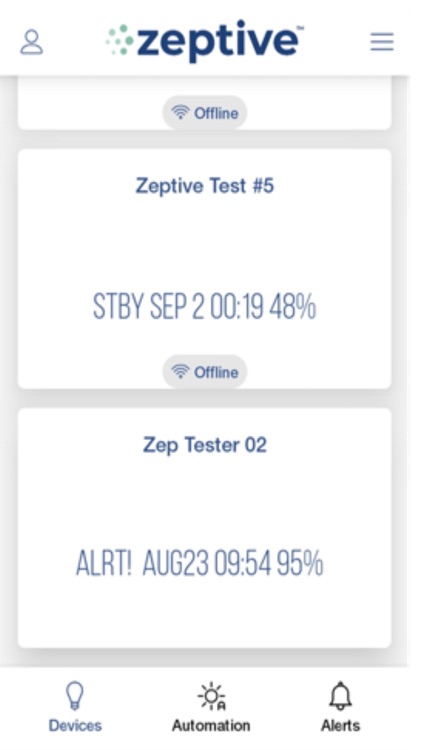
The Dashboard shows a summary view of the device status. The Readings page is an overview of the current data view and historical data view. The Settings page allows users to modify system parameters. The Dashboard and Readings pages updated as data changes on the sensors and get relayed to the Zeptive application. The Settings page changes how the device is configured.
The Dashboard page shows the status of the instrument. The four states are READY, STANDBY (STBY), ALERT, ERROR. In the Ready State the system is ready to analyze the environment. In Standby the system has finished analyzing the environment and is in sleep mode. An Alert state is displayed when the system detects a tamper event or a vape event. An Error state describes a hardware failure in the system. The Dashboard also shows the date and time and the battery charge of the system. Users can view more details on the Alerts from the lower right corner tab. Each alert event is shown in chronological order of the events.
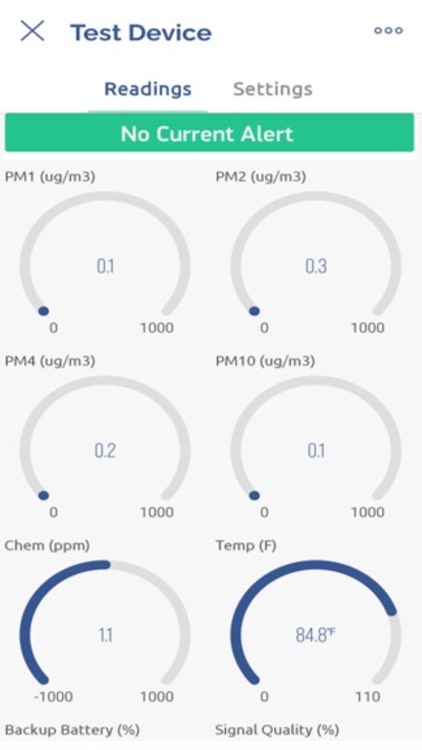
The Readings Page can be selected by clicking on the main dashboard tile for the sensor of interest. The Readings Page displays the data outputs from the sensors for a selected system. Users can also see quickly if there is an Alert or the system has No Alert. Gauges are used as a tool to show each sensor output while historical data can be viewed in graphs. The time range of the graphs can be selected to see live data all the way up to 90 days past.
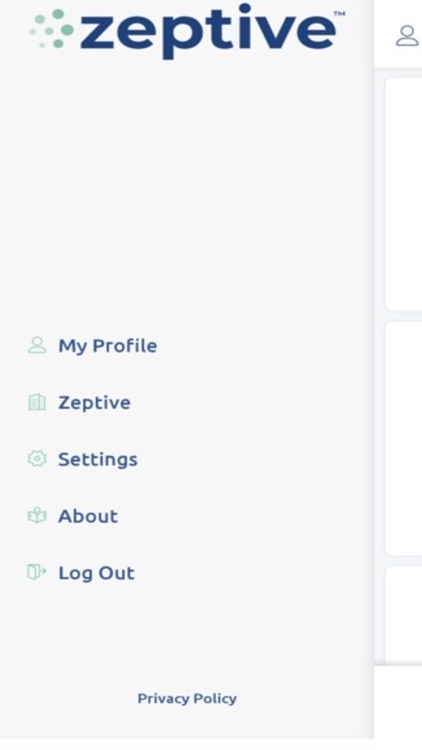
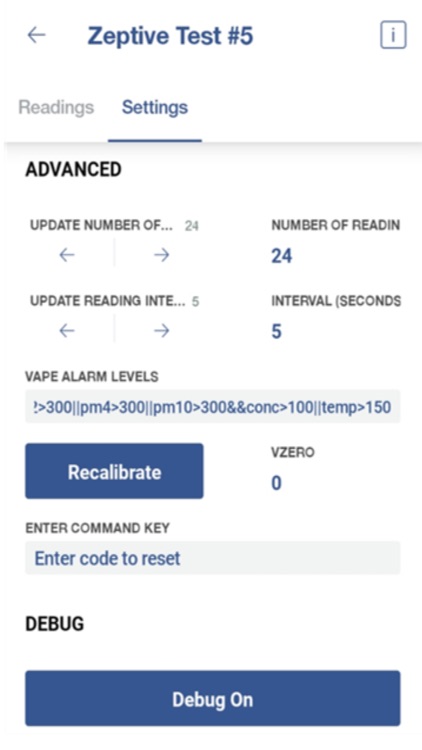
The Settings Page allows users to modify detection and warning parameters of the sensors. Users can modify the detection thresholds and data transmission rates as well as the time zone of the system. There is also a button to turn the audible buzzer on or off and a debug window for troubleshooting.
Disclaimer:
AppAdvice does not own this application and only provides images and links contained in the iTunes Search API, to help our users find the best apps to download. If you are the developer of this app and would like your information removed, please send a request to takedown@appadvice.com and your information will be removed.
AppAdvice does not own this application and only provides images and links contained in the iTunes Search API, to help our users find the best apps to download. If you are the developer of this app and would like your information removed, please send a request to takedown@appadvice.com and your information will be removed.