You are using an outdated browser. Please
upgrade your browser to improve your experience.

The Art of Stat: Inference app provides access to the following modules:

Art of Stat: Inference
by Bernhard Klingenberg

What is it about?
The Art of Stat: Inference app provides access to the following modules:
App Screenshots

App Store Description
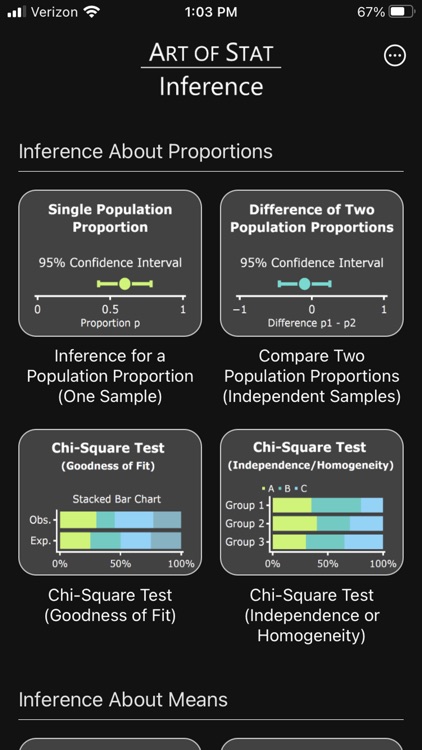
The Art of Stat: Inference app provides access to the following modules:
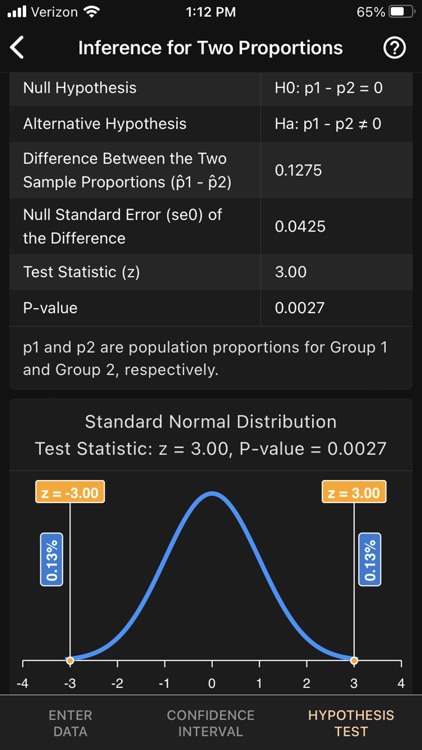
- Inference for Proportions (one and two independent samples)
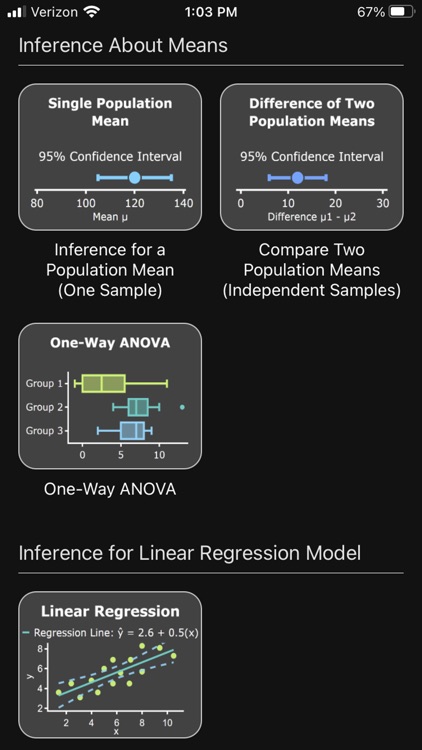
- Inference for Means (one and two independent samples)
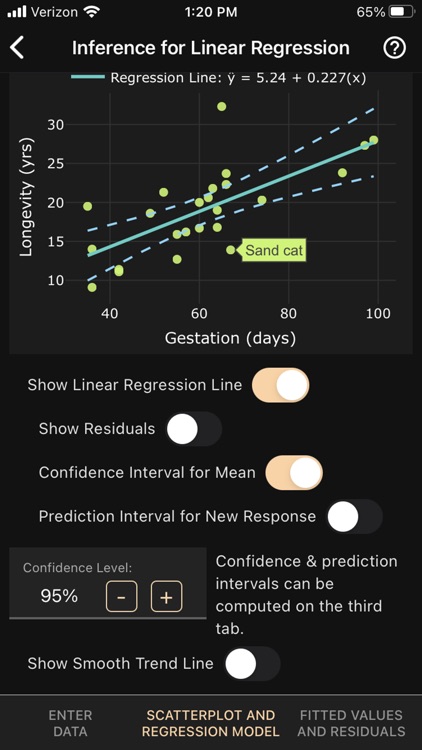
- Inference in Linear Regression Models (slope, confidence & prediction intervals)
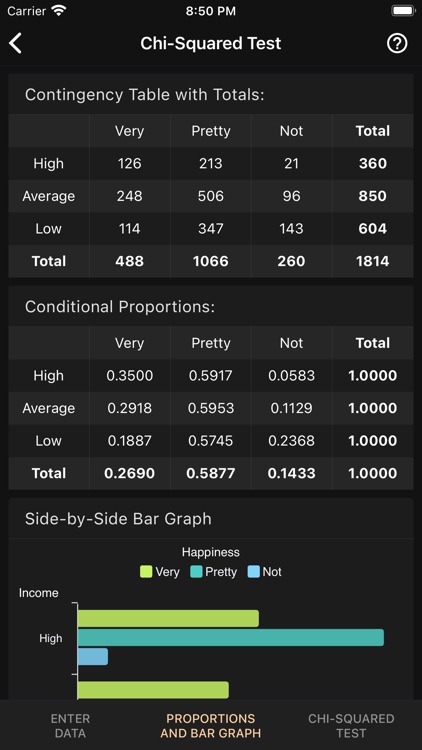
- Chi-square Test (Independence/Homogeneity and Goodness of Fit)
- One-way ANOVA for comparing several means
Unlock all modules for a one-time small fee.
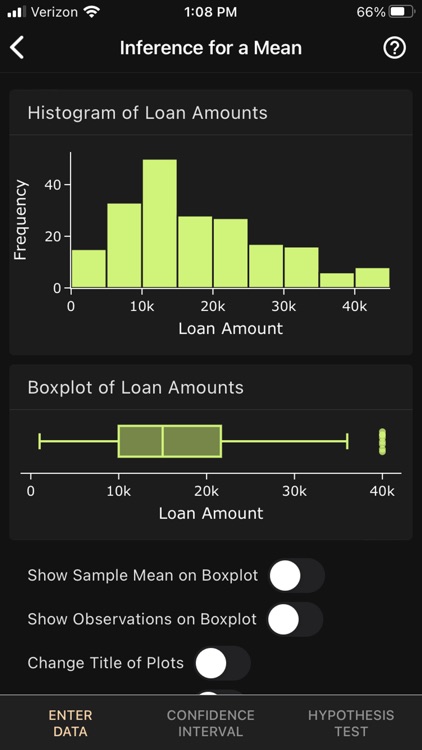
Entering your own data is easy:
If you just have a few observations (or if you have the summary statistics), simply type them in. For larger datasets, upload a CSV file of your raw data to a cloud account (such as iCloud or Google Drive) or simply email the file to yourself. Then, open the CSV file in the app and select the variables for your analysis. You can also simply copy & paste raw data from a spreadsheet app (Such as Numbers on iOS or Google sheets). Sample datasets are provided.
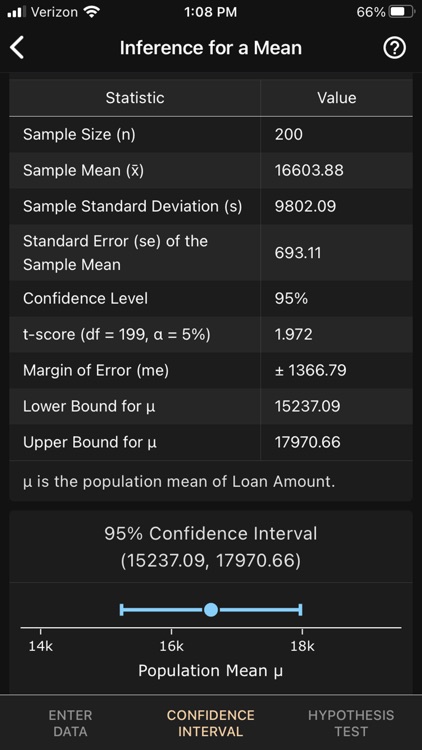
The results are stunning:
The app provides relevant plots (side-by-side or stacked bar charts, boxplots, histograms) and computes and visualizes confidence intervals and P-values for testing hypotheses. All relevant information (such as standard errors, margin of errors, z or t scores and degrees of freedom) are clearly displayed and labeled. The P-value is visualized on a graph for the normal, t-, or Chi-Squared distribution.
Developed for both students and teachers as a handy tool for carrying out basic statistical inference and visualize results on the fly.
The app works in on- and offline mode (the app indicates that it is in offline mode with a large green banner), which makes it suitable for exams.
The app also has dedicated modules for exploring concepts such as the coverage probability for confidence intervals or the concepts of Type I & II errors and power. It can actually find the Type II error and power for tests of proportions (and certain tests for means.)
Easily share your results by taking screenshots.
Disclaimer:
AppAdvice does not own this application and only provides images and links contained in the iTunes Search API, to help our users find the best apps to download. If you are the developer of this app and would like your information removed, please send a request to takedown@appadvice.com and your information will be removed.
AppAdvice does not own this application and only provides images and links contained in the iTunes Search API, to help our users find the best apps to download. If you are the developer of this app and would like your information removed, please send a request to takedown@appadvice.com and your information will be removed.