You are using an outdated browser. Please
upgrade your browser to improve your experience.

ChartoXYMako is a graph maker app that allows you to create a chart by providing x and y-axis values

ChartoXYMako
by Yan Hoi Shan


What is it about?
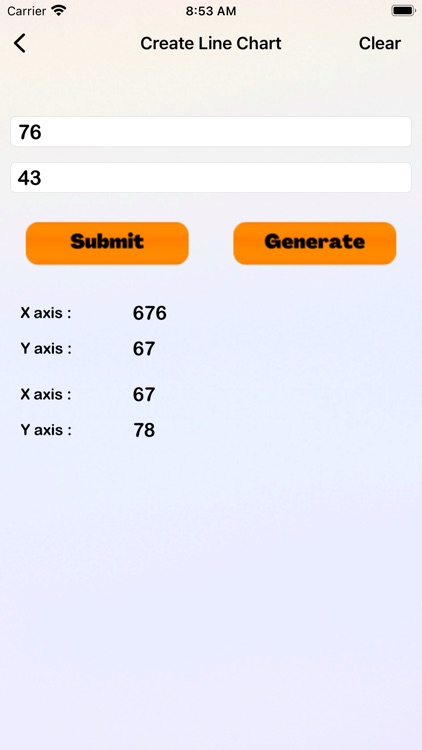
ChartoXYMako is a graph maker app that allows you to create a chart by providing x and y-axis values. the app is simple and easy to use with a great user interface and allows you to learn about how the x and y-axis value is placed on the chart. the app is helpful for students who started learning chart making. the app support two types of chart line and curved. Tap on any of the chart buttons (Line, Curve) from the main app screen, and it will take you to the additional data screen where you need to provide value values of x and y in their respective fields tap on the entering button and after the value shown below, you need tap on create button. the app will create a chart based on the values provided by you. from there you can share chart or save. the history button from the main screen will show the app saved by you. by tapping on any one of them it will show you the chart.
App Screenshots

App Store Description
ChartoXYMako is a graph maker app that allows you to create a chart by providing x and y-axis values. the app is simple and easy to use with a great user interface and allows you to learn about how the x and y-axis value is placed on the chart. the app is helpful for students who started learning chart making. the app support two types of chart line and curved. Tap on any of the chart buttons (Line, Curve) from the main app screen, and it will take you to the additional data screen where you need to provide value values of x and y in their respective fields tap on the entering button and after the value shown below, you need tap on create button. the app will create a chart based on the values provided by you. from there you can share chart or save. the history button from the main screen will show the app saved by you. by tapping on any one of them it will show you the chart.
Disclaimer:
AppAdvice does not own this application and only provides images and links contained in the iTunes Search API, to help our users find the best apps to download. If you are the developer of this app and would like your information removed, please send a request to takedown@appadvice.com and your information will be removed.
AppAdvice does not own this application and only provides images and links contained in the iTunes Search API, to help our users find the best apps to download. If you are the developer of this app and would like your information removed, please send a request to takedown@appadvice.com and your information will be removed.