You are using an outdated browser. Please
upgrade your browser to improve your experience.

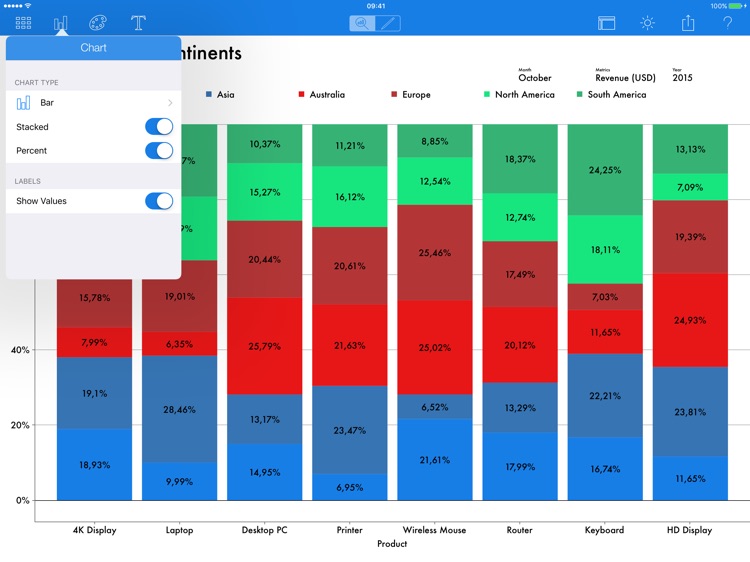
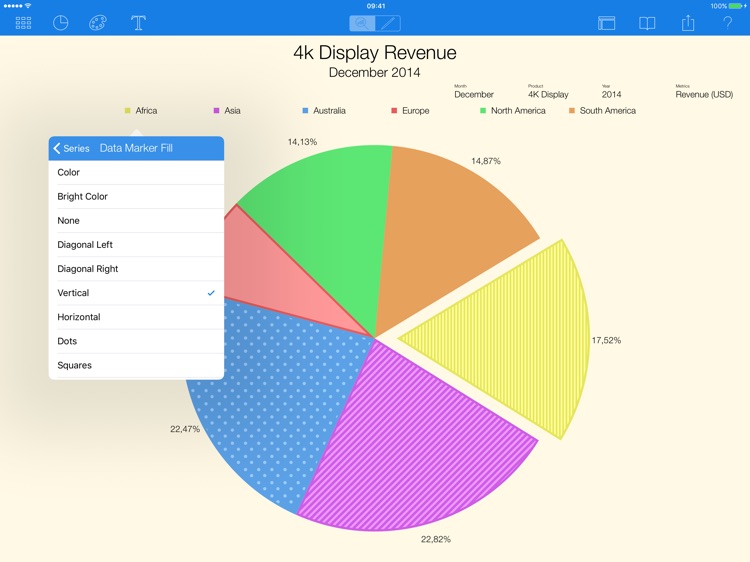
Experience true multi-gesture interactivity with Charts

Charts - Data Visualization and Business Analytics
by EVODATA Consulting
What is it about?
Experience true multi-gesture interactivity with Charts. Pivot dimensions, turn pages, hide series elements, sort data, change orientation, explode pie or donut slices, rotate pie and donut, change donut width with simple gestures.
Charts is FREE but there are more add-ons
-
$1.99
Formatting Pack
-
$3.99
Charts Pack
App Screenshots
App Store Description
Experience true multi-gesture interactivity with Charts. Pivot dimensions, turn pages, hide series elements, sort data, change orientation, explode pie or donut slices, rotate pie and donut, change donut width with simple gestures.
Create professional looking charts quickly, using a wide range of visualization and formatting options. Define your datasets only once and reuse them later with different chart types.
If you like Charts please take the time to rate the app or write a nice review! We would really appreciate it!
If you have some suggestions or find some bugs please contact us at support@evodata.hu.
* * * What you get:
VISUALIZATION
- single bar/column chart
- grouped, clustered bar/column chart
- vertical and horizontal orientation
DATA
- manual data entry
- unlimited datasets
- up to 12 metrics per dataset
- up to 6 dimensions per dataset
- unlimited dimension elements
- automatic aggregation
ANALYTICS
- pivot metrics and dimensions
- turn pages to select data slices or simply filter data
- hide serie elements
- sort data alphabetically or by value
FORMATTING
- Day view mode
- 12 fonts
- 3 color themes
- standard data markers
- align title and subtitle
- automatic legend sizing and alignment
- automatic label sizing and alignment
- automatic data range calculation
SHARING
- save charts locally in Photos
- email charts as pictures
- print charts
* * * What you can ADD:
CHARTS PACK
- Chart types
- Line
- Area
- Pie
- Donut
- Chart subtypes (for bar, line, area)
- Stacked
- Percent
FORMATTING PACK
- additional View Modes
- additional Color Themes
- Axis formatting
- Gridline styles and spacing
- Tick Mark positions
- element layout
- value formats
- Series formatting
- additional Data Marker shapes, fills and outline
- series label alignment
- Explode any pie or donut slices
- Change Donut width
Disclaimer:
AppAdvice does not own this application and only provides images and links contained in the iTunes Search API, to help our users find the best apps to download. If you are the developer of this app and would like your information removed, please send a request to takedown@appadvice.com and your information will be removed.
AppAdvice does not own this application and only provides images and links contained in the iTunes Search API, to help our users find the best apps to download. If you are the developer of this app and would like your information removed, please send a request to takedown@appadvice.com and your information will be removed.