You are using an outdated browser. Please
upgrade your browser to improve your experience.

This App allows for the determination of the concentration of target analytes or chemical species, performing a colour analysis of both the calibration samples (titration procedure) and the test samples

Colorimetric Titration
by UNIVERSIDAD DE BURGOS

What is it about?
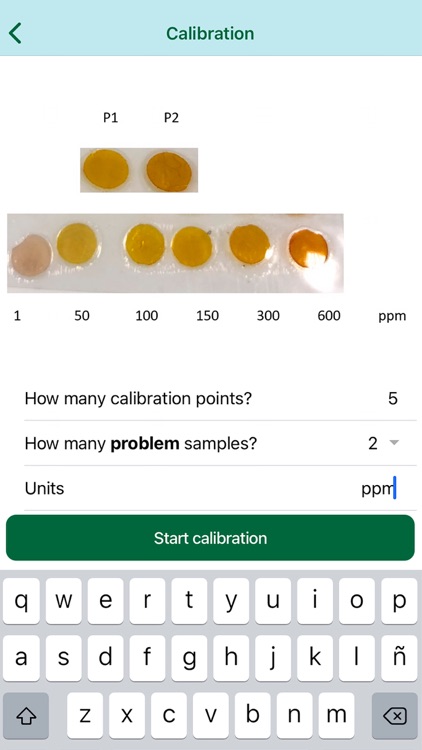
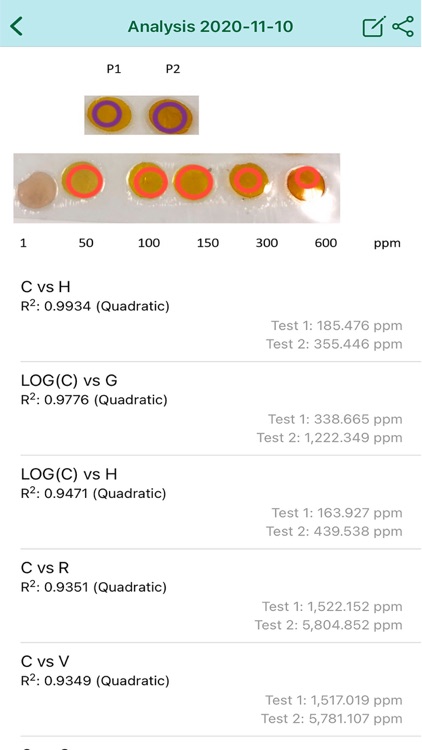
This App allows for the determination of the concentration of target analytes or chemical species, performing a colour analysis of both the calibration samples (titration procedure) and the test samples. For that, a photograph of both the different calibration samples and the test samples (problem samples) should be taken. Then, the circular selector should be placed over each sample for the colour analysis, and finally the app will show the graphical representation of the concentration versus different colour parameters (R, G, B, H, S, V, RGB, ∆RGB). The best fitting curve (linear or quadratic), i.e., the fitting curve with the highest R2 parameter, will appear in the first position. The app shows the calculated concentrations of the test sample/s.
App Store Description
This App allows for the determination of the concentration of target analytes or chemical species, performing a colour analysis of both the calibration samples (titration procedure) and the test samples. For that, a photograph of both the different calibration samples and the test samples (problem samples) should be taken. Then, the circular selector should be placed over each sample for the colour analysis, and finally the app will show the graphical representation of the concentration versus different colour parameters (R, G, B, H, S, V, RGB, ∆RGB). The best fitting curve (linear or quadratic), i.e., the fitting curve with the highest R2 parameter, will appear in the first position. The app shows the calculated concentrations of the test sample/s.
Disclaimer:
AppAdvice does not own this application and only provides images and links contained in the iTunes Search API, to help our users find the best apps to download. If you are the developer of this app and would like your information removed, please send a request to takedown@appadvice.com and your information will be removed.
AppAdvice does not own this application and only provides images and links contained in the iTunes Search API, to help our users find the best apps to download. If you are the developer of this app and would like your information removed, please send a request to takedown@appadvice.com and your information will be removed.