You are using an outdated browser. Please
upgrade your browser to improve your experience.

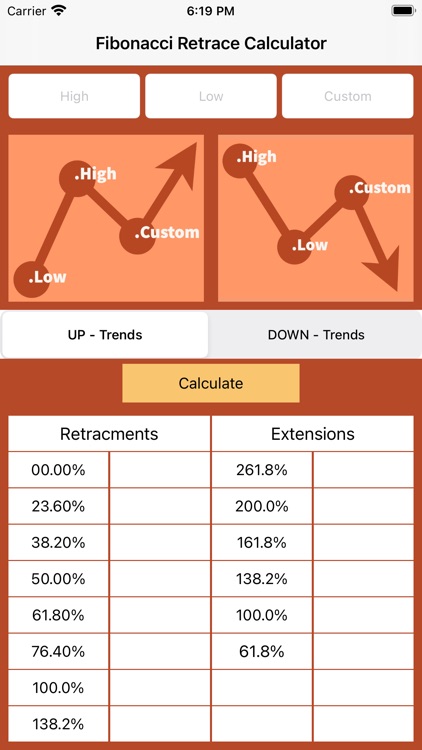
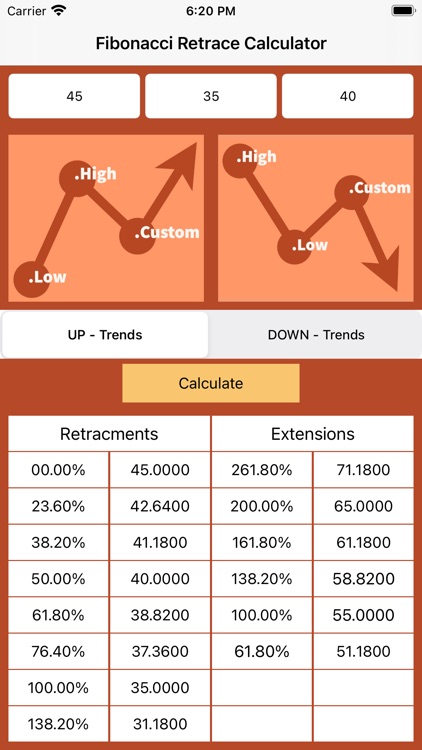
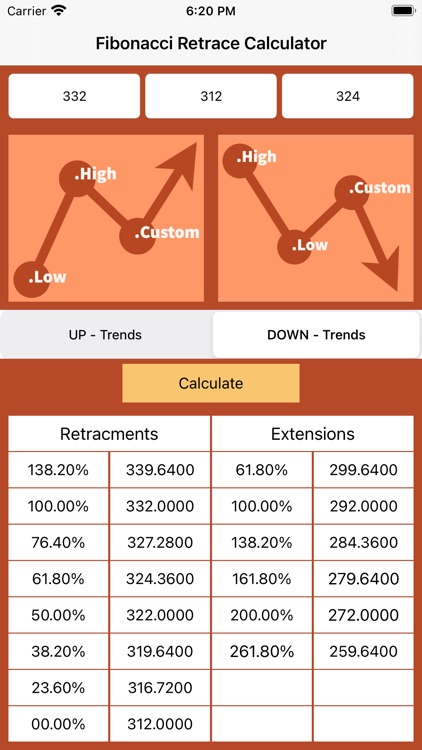
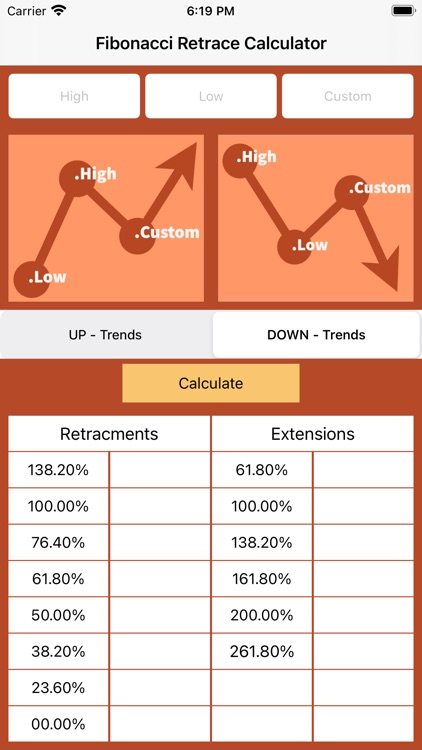
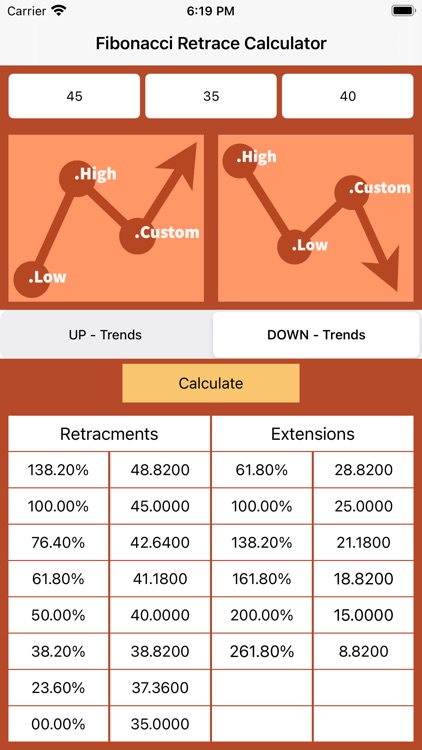
This calculator application is to help stock or forex traders in trading to determine the key levels of Fibonacci retracement or Fibonacci extensions / expansion by input high, low and custom values

Fibonacci Retrace Calculator
by Ravi Malakar
What is it about?
This calculator application is to help stock or forex traders in trading to determine the key levels of Fibonacci retracement or Fibonacci extensions / expansion by input high, low and custom values.
App Screenshots
App Store Description
This calculator application is to help stock or forex traders in trading to determine the key levels of Fibonacci retracement or Fibonacci extensions / expansion by input high, low and custom values.
Fibonacci retracement is a very popular tool among technical traders and is based on the key numbers identified by mathematician Leonardo Fibonacci in the thirteenth century. Fibonacci retracement levels use horizontal lines to indicate areas of support or resistance at the key Fibonacci levels before the trend continues in the original direction. These levels are created by drawing a trendline between the high and low and then dividing the vertical distance by the key Fibonacci ratios. Fibonacci's sequence of numbers is not as important as the mathematical relationships, expressed as ratios, between the numbers in the series. In technical analysis, Fibonacci retracement is created by taking two extreme points on a stock chart and dividing the vertical distance by the key Fibonacci ratios of 23.6%, 38.2%, 50%, 61.8% and 100%. Once these levels are identified, horizontal lines are drawn and used to identify possible support and resistance levels. Fibonacci retracement price levels can be used as buy triggers on pullbacks during an uptrend.
Disclaimer:
AppAdvice does not own this application and only provides images and links contained in the iTunes Search API, to help our users find the best apps to download. If you are the developer of this app and would like your information removed, please send a request to takedown@appadvice.com and your information will be removed.
AppAdvice does not own this application and only provides images and links contained in the iTunes Search API, to help our users find the best apps to download. If you are the developer of this app and would like your information removed, please send a request to takedown@appadvice.com and your information will be removed.