You are using an outdated browser. Please
upgrade your browser to improve your experience.
Google Charts is a pure JavaScript based charting library meant to enhance web applications by adding interactive charting capability

Google Charts Tutorial
by nguyen hai

What is it about?
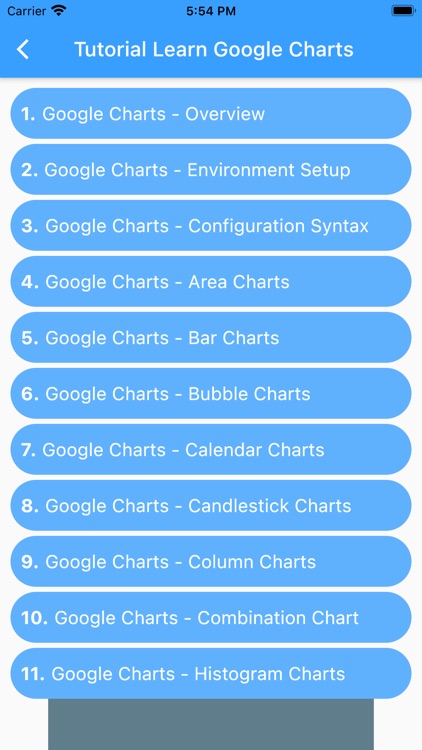
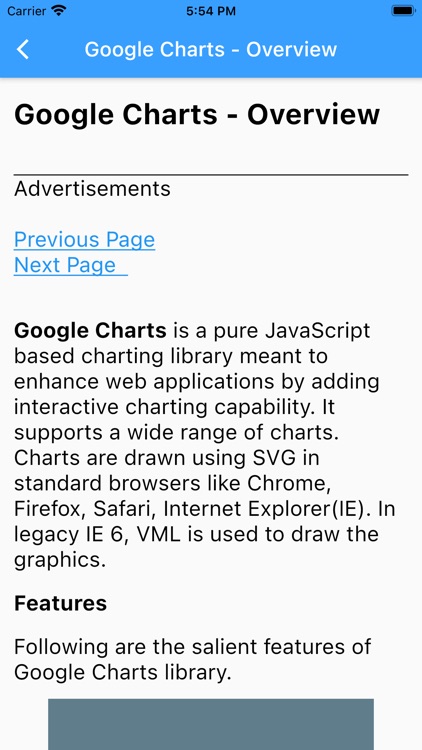
Google Charts is a pure JavaScript based charting library meant to enhance web applications by adding interactive charting capability. Google Charts provides wide variety of charts. For example, line charts, spline charts, area charts, bar charts, pie charts and so on.
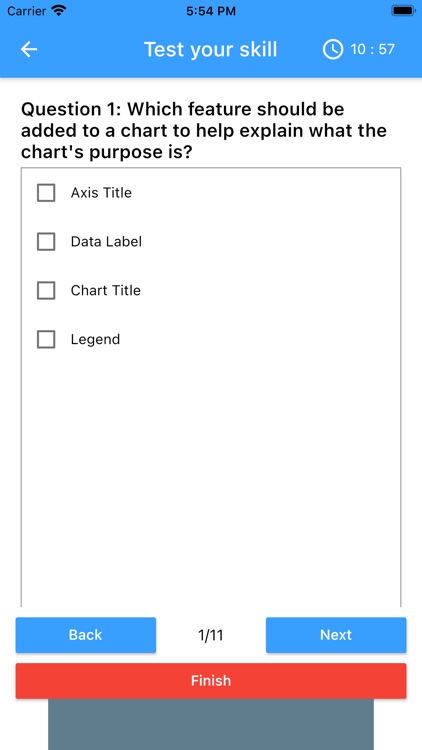
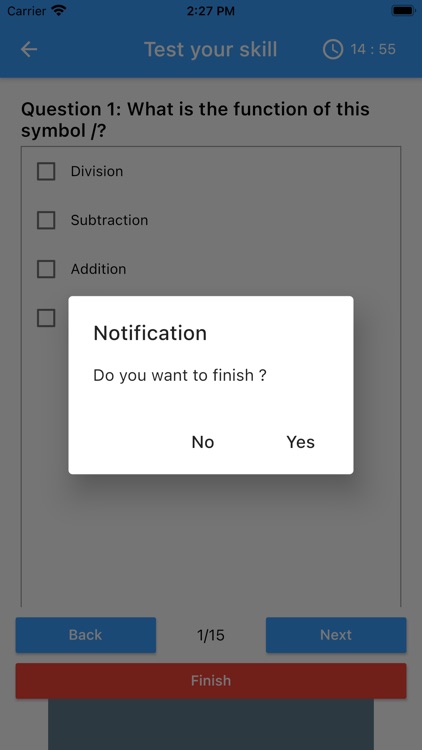
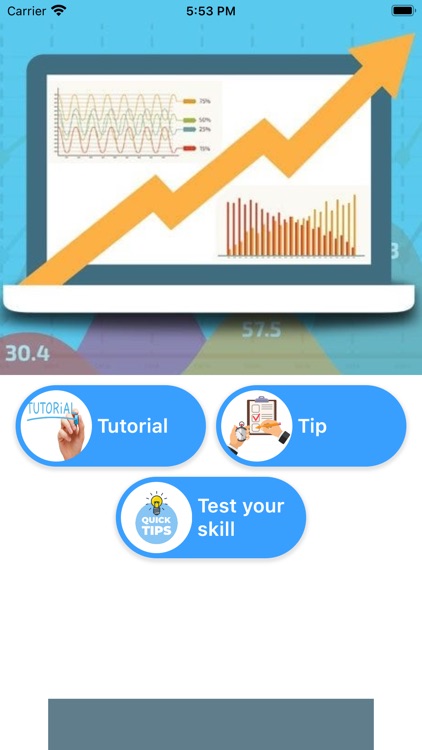
App Screenshots

App Store Description
Google Charts is a pure JavaScript based charting library meant to enhance web applications by adding interactive charting capability. Google Charts provides wide variety of charts. For example, line charts, spline charts, area charts, bar charts, pie charts and so on.
This tutorial will teach you basics of Google Charts. Tutorial contains chapters discussing all the basic components of Google Charts with suitable examples.
Disclaimer:
AppAdvice does not own this application and only provides images and links contained in the iTunes Search API, to help our users find the best apps to download. If you are the developer of this app and would like your information removed, please send a request to takedown@appadvice.com and your information will be removed.
AppAdvice does not own this application and only provides images and links contained in the iTunes Search API, to help our users find the best apps to download. If you are the developer of this app and would like your information removed, please send a request to takedown@appadvice.com and your information will be removed.