You are using an outdated browser. Please
upgrade your browser to improve your experience.
This application utilizes 20+ years of fish survey data to determine where your best fishing opportunities are for halibut, rock fish, sable fish and pacific cod

GotHalibut
by Pete Parks
What is it about?
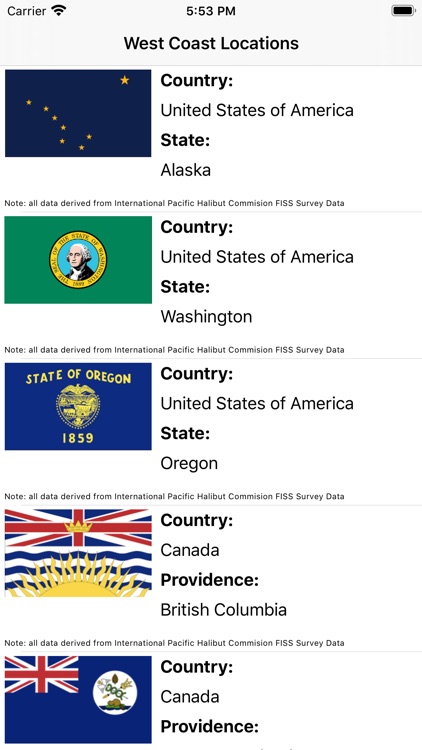
This application utilizes 20+ years of fish survey data to determine where your best fishing opportunities are for halibut, rock fish, sable fish and pacific cod. Use the QuickLook view to identify the higher verses lower productivity fishing areas. Each year, thousands of surveys are conducted along the West Coast (Alaska to California) for halibut and bycatch species. This app utilizes the data which IPHC FISS survey provides for regulating the catch quota for halibut. For commercial fisherman this tool makes viewing latitude and longitude survey data much easier than combing through data files.
App Store Description
This application utilizes 20+ years of fish survey data to determine where your best fishing opportunities are for halibut, rock fish, sable fish and pacific cod. Use the QuickLook view to identify the higher verses lower productivity fishing areas. Each year, thousands of surveys are conducted along the West Coast (Alaska to California) for halibut and bycatch species. This app utilizes the data which IPHC FISS survey provides for regulating the catch quota for halibut. For commercial fisherman this tool makes viewing latitude and longitude survey data much easier than combing through data files.
Key Features Are:
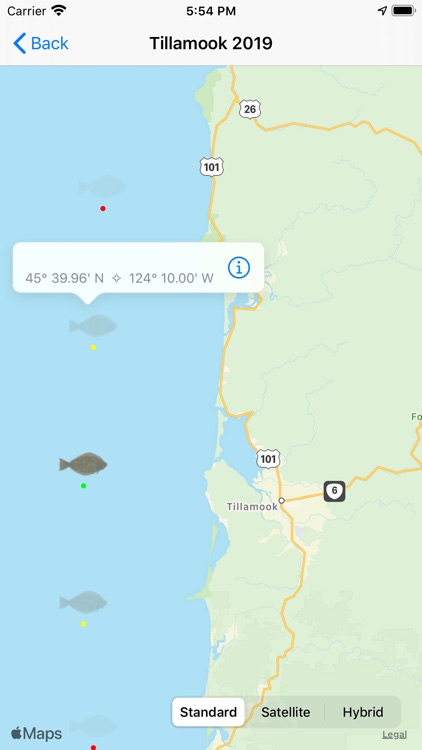
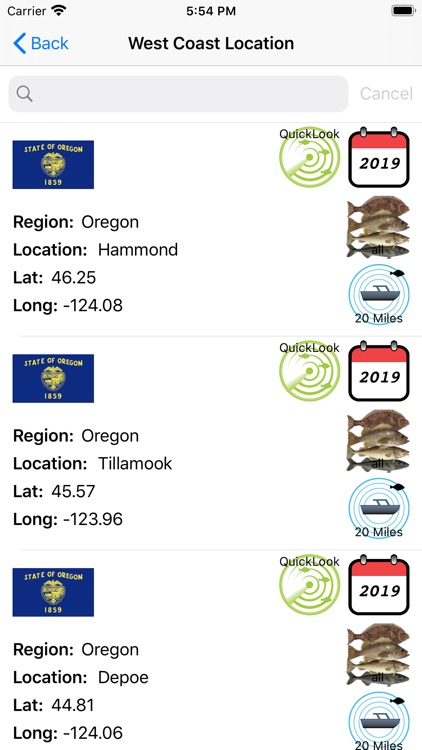
• QuickLook for visual population based on survey data.
• Selection of survey data is just one touch away.
• Customize visual data based on year, species, port and radius of data to visualize.
• Visualize survey data by a green, yellow or red indicator of fish populations.
• Each annotation on the map provides quantity of each species as well as average weigths per site.
Currently works with iOS 13.0 or better iPhone and iPad
Disclaimer:
AppAdvice does not own this application and only provides images and links contained in the iTunes Search API, to help our users find the best apps to download. If you are the developer of this app and would like your information removed, please send a request to takedown@appadvice.com and your information will be removed.
AppAdvice does not own this application and only provides images and links contained in the iTunes Search API, to help our users find the best apps to download. If you are the developer of this app and would like your information removed, please send a request to takedown@appadvice.com and your information will be removed.