You are using an outdated browser. Please
upgrade your browser to improve your experience.
"High-Frequency Noise Monitor" is a high-frequency noise analysis tool that specializes in high-frequency bands above 8 kHz

High-Frequency Noise Monitor
by TOON,LLC

What is it about?
"High-Frequency Noise Monitor" is a high-frequency noise analysis tool that specializes in high-frequency bands above 8 kHz.
App Screenshots
App Store Description
"High-Frequency Noise Monitor" is a high-frequency noise analysis tool that specializes in high-frequency bands above 8 kHz.
You may be exposed to artificial high-frequency noise on a daily basis that is inaudible to the human ear. This app allows you to monitor such high frequency noises and examine their occurrence.
In general, noise may contain relatively high frequency components depending on its source, and this is classified as high frequency noise.
For example, harmonic noise is radiated from the main body of an electronic device or the power lines of a power conversion device such as an AC-DC power adapter, and depending on its power level, it may affect peripheral devices.
There are also devices that generate high-frequency noise to drive away vermin such as rats and weasels. The frequency of the sound varies depending on the type of vermin, and some devices incorporate sensors to change the volume and frequency over time. When such devices are installed in the vicinity, there are cases where they can lead to noise problems with adverse effects on human health.
High-frequency noise does not often occur at a constant volume or frequency, but often occurs in a certain cycle or randomly. It is not easy to detect such high-frequency noise.
This app records randomly fluctuating high-frequency noise from the iPhone built-in microphone and performs frequency analysis in real time.
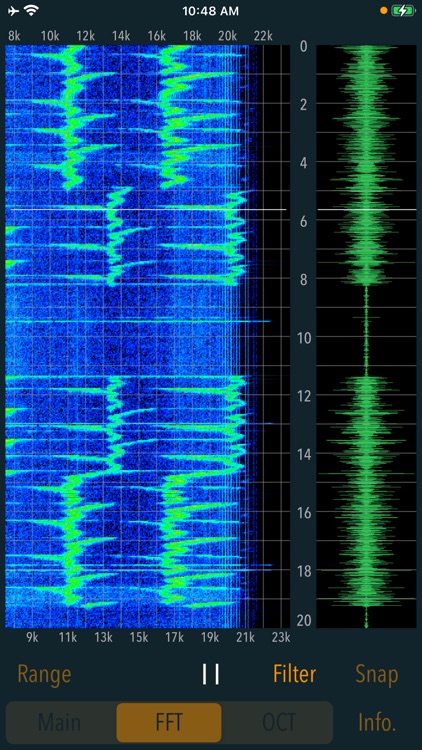
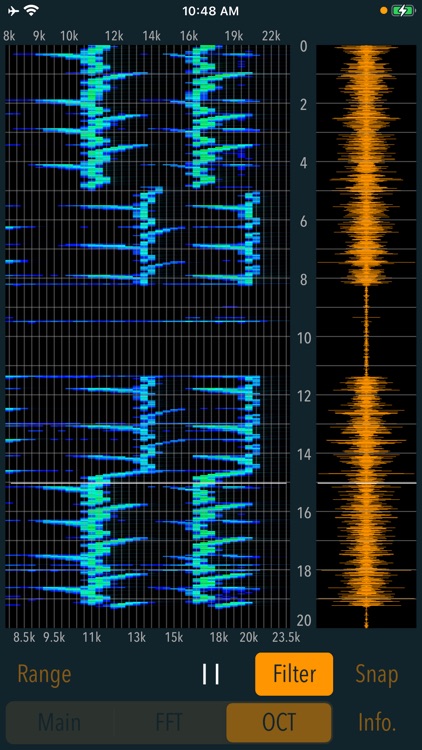
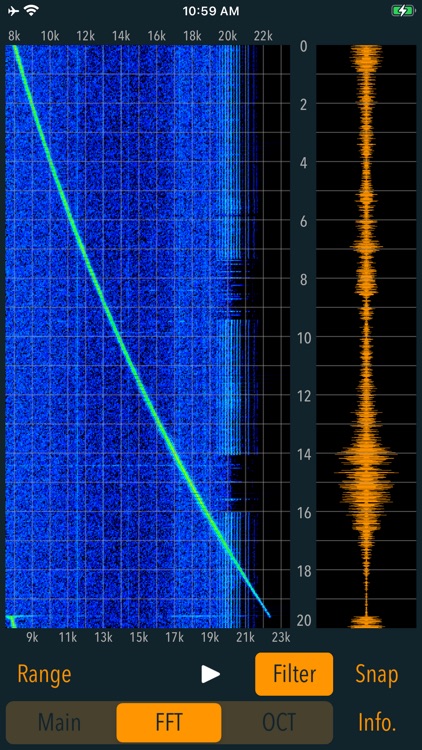
In addition, it retains the PCM data for 20 seconds just before the measurement is stopped, and displays a spectrogram of FFT and octave band analysis. The spectrogram is a graph showing the analysis results of the frequency spectrum of sound with time on the vertical axis, frequency on the horizontal axis, and signal strength in colors, allowing visual observation of the occurrence of high-frequency noise.
Features:
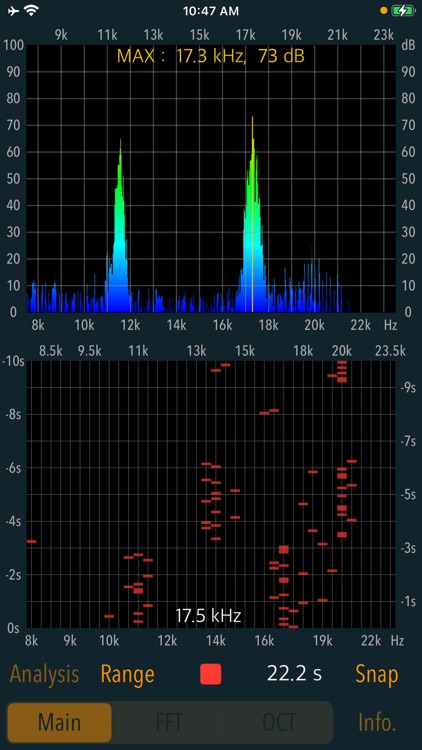
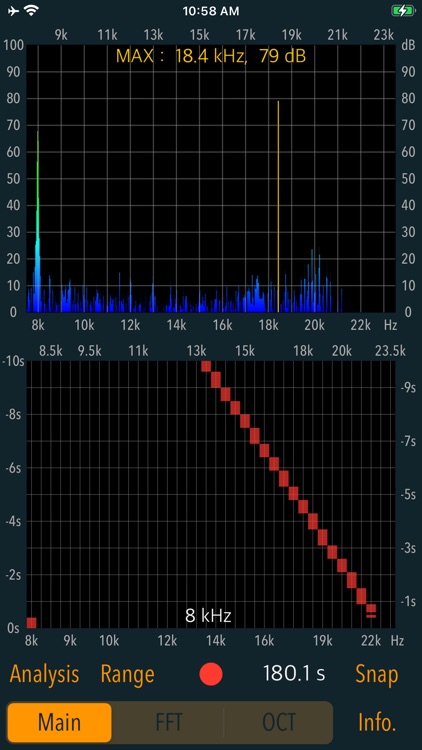
# Main: Real-time frequency analysis function.
- Real-time measurement: Automatically stops after a maximum of approximately 180 seconds.
- Maximum frequency detection and power level display (dB unit in 20 μPa standard)
- Time trace display: approx. 10 seconds
- Display gain adjustment (Range): 3 levels (0dB - 90dB / -10dB - 80dB / -20dB - 70dB)
# Analysis: FFT/octave band spectrogram analysis function (PCM data for 20 seconds immediately before the measurement is stopped is saved, and spectrogram analysis is performed.)
- FFT spectrogram analysis (FFT)
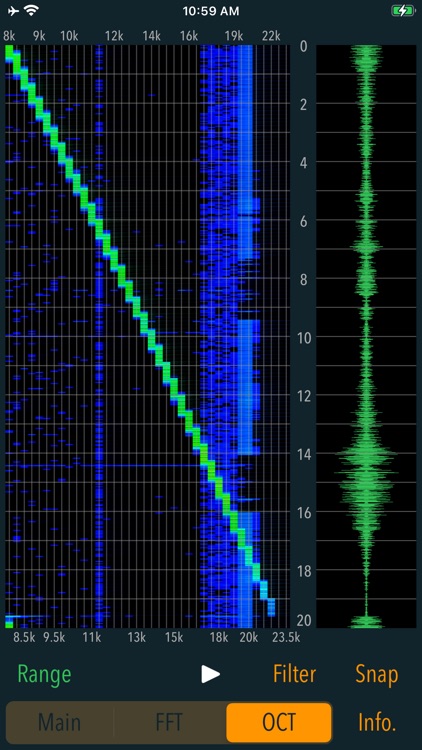
- Octave spectrogram analysis (OCT)
- Display gain switching (Range): 3 levels
- Playback function: approx. 20 seconds.
- Playback sound filter (Filter): 8kHz high-pass filter to cut off low-mid range sound.
# Snapshot (Snap): Save the analysis result as an image file.
Operation Procedure:
1) Sound measurement and real-time frequency analysis (Main)
Tap Start button in Main mode to start measurement. It displays the real-time instantaneous frequency analysis result and the trace of frequency time variation. The frequency and signal level at which the maximum level is detected can be displayed numerically.
2) Spectrogram analysis (Analysis)
After measurement in Main mode, tap the Analysis button to perform spectrogram analysis. Tap FFT or OCT button to display the spectrogram by FFT or octave band analysis.
3) Snapshot
By tapping Snap button, you can save the measurement result as an image file in "Photos". A time stamp will be inserted into the image.
Notes:
- The measurement of high frequency sounds depends on the sensitivity characteristics of the built-in microphone, so it may vary depending on the iPhone model.
- Wireless (Bluetooth) headphones and headset are not supported.
- This app accesses the built-in microphone. At the time of initial launch, the iOS system will ask you to approve the access, which you must do. If you do not allow it, you will not be able to use the microphone due to iOS privacy restrictions. In such a case, go to the iOS basic settings (Settings > Privacy > Microphone) and allow access from this app.
Disclaimer:
AppAdvice does not own this application and only provides images and links contained in the iTunes Search API, to help our users find the best apps to download. If you are the developer of this app and would like your information removed, please send a request to takedown@appadvice.com and your information will be removed.
AppAdvice does not own this application and only provides images and links contained in the iTunes Search API, to help our users find the best apps to download. If you are the developer of this app and would like your information removed, please send a request to takedown@appadvice.com and your information will be removed.