You are using an outdated browser. Please
upgrade your browser to improve your experience.

Including Singapore, Malaysia, Thailand and Indonesia market data

Homily Chart
by CapitalMaster Pte. Ltd.
What is it about?
Including Singapore, Malaysia, Thailand and Indonesia market data.
App Details
Version
6.3.4
Rating
(40)
Size
431Mb
Genre
Finance Reference
Last updated
February 1, 2024
Release date
December 1, 2012
More info
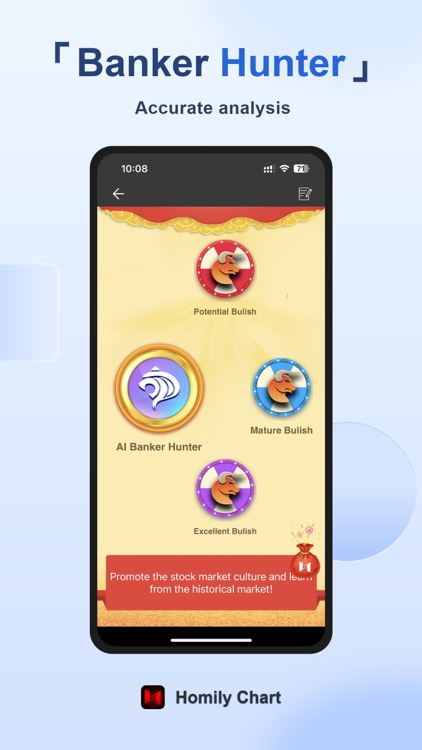
App Screenshots
App Store Description
Including Singapore, Malaysia, Thailand and Indonesia market data.
-----------
Homily software came into the world in August 8, 1998 when China stock market and information technology were in the ascendant. Its investment philosophy — Index, first; stock, next. Long-term, first; short-term, next. Operate the Familiar. — is derived from America capital market, and has been proved correct and valuable in the capital market of China, Singapore , Malaysia, etc. It takes technical analysis and trend theory as product core, and provides analytical softwares, training courses, etc. We believe that a winner in the stock market should be equipped with right method, professional tool and nice mindset.
Homily Chart, which was called Handheld Homily Software before, was available in 2012. It is a concentrated version which has 14 years experience and intelligence, an updated version based on Homily end of day analysis and dynamic quotation data, and a simplified version which combines classical technical analysis, decision making system and portfolio management.
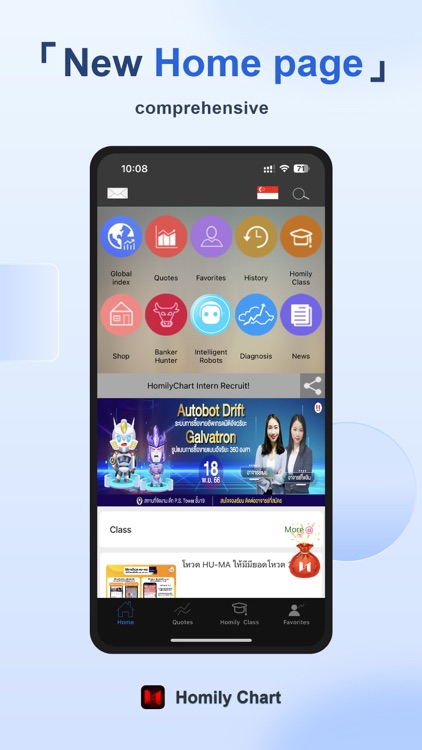
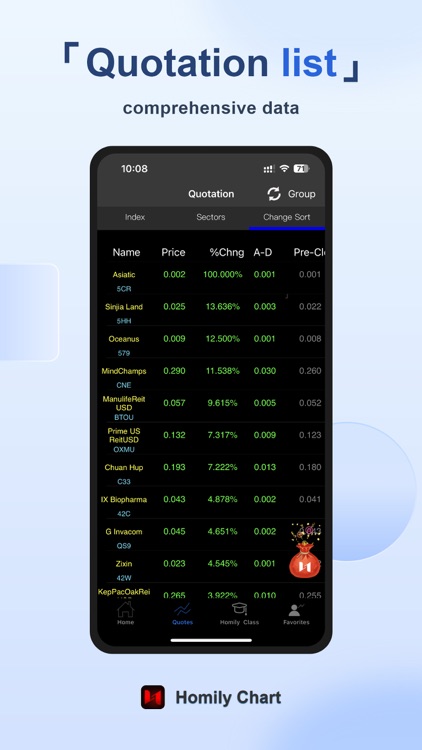
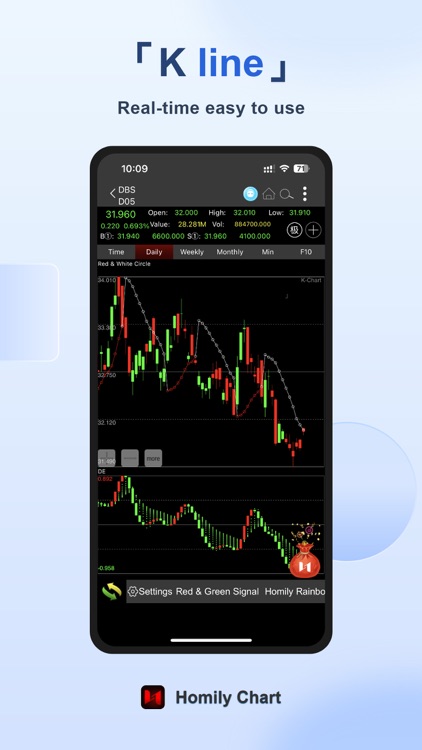
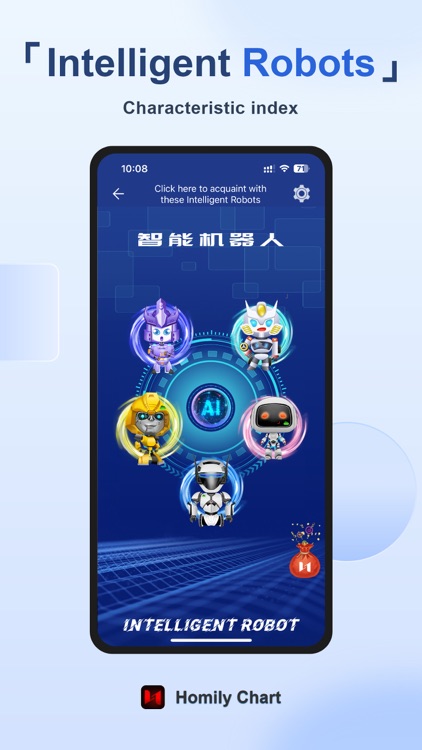
Homily Chart proposes "rational investment and making profits simply". It displays the market data, reveals the market behavior, unearthes hotspots, judges the price trend, and analyzes the current market situation through visualized chart to assist the users with rational investment. Its main functions include the market data browse, indices and industries analysis, the inraday chart of indices, sector indices and individual stocks and multi period candlestick chart. There are a series of technical indicators including some classic and usual indicators such as KDJ, MACD, etc., and Homily proprietary functions such as Homily Rainbow, Multi-color Dragon, Red & White Circle, etc. It also supports linedraw on the candlestick chart to meet the technical analysis tangent line amateurs needs.
Homily Chart is goting to be commiteed to provide investors with more convenient and efficient assistive tools through function upgrade and user experience, and perfect the offical website www.HomilyChart.com to serve the investors comprehensively. If you have unique ideas or requirements, please let us know through Review. Your participating, suggestion and encouragement would be our motive power to go forward and develop.
Investment has a risk, entering the market must be cautious!
Disclaimer:
AppAdvice does not own this application and only provides images and links contained in the iTunes Search API, to help our users find the best apps to download. If you are the developer of this app and would like your information removed, please send a request to takedown@appadvice.com and your information will be removed.
AppAdvice does not own this application and only provides images and links contained in the iTunes Search API, to help our users find the best apps to download. If you are the developer of this app and would like your information removed, please send a request to takedown@appadvice.com and your information will be removed.