You are using an outdated browser. Please
upgrade your browser to improve your experience.
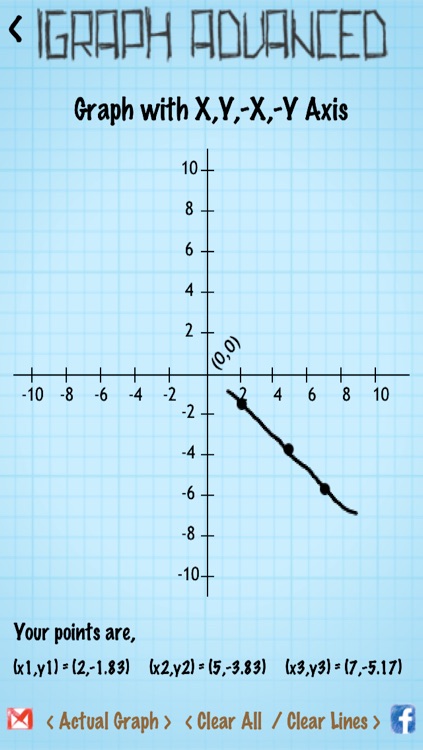
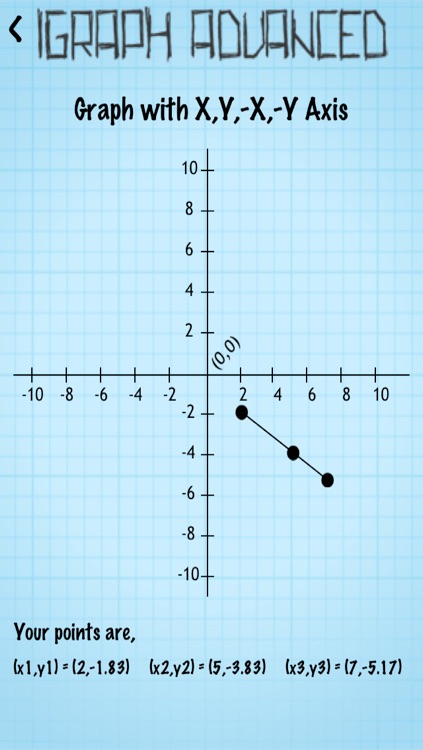
iGraph - Advanced app helps the user to plot and create lines on a graph

iGraph - Advanced
by Anand Tech Media Private Limited
What is it about?
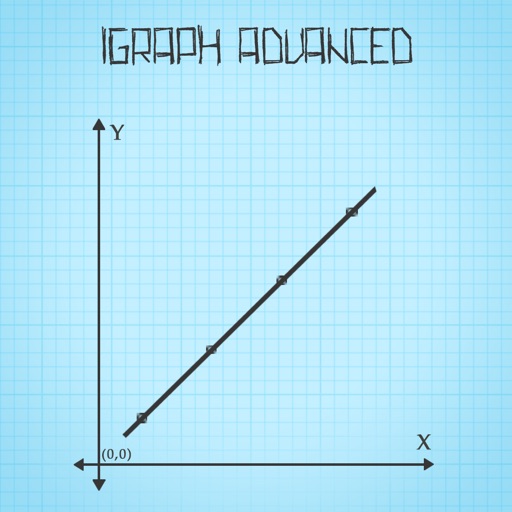
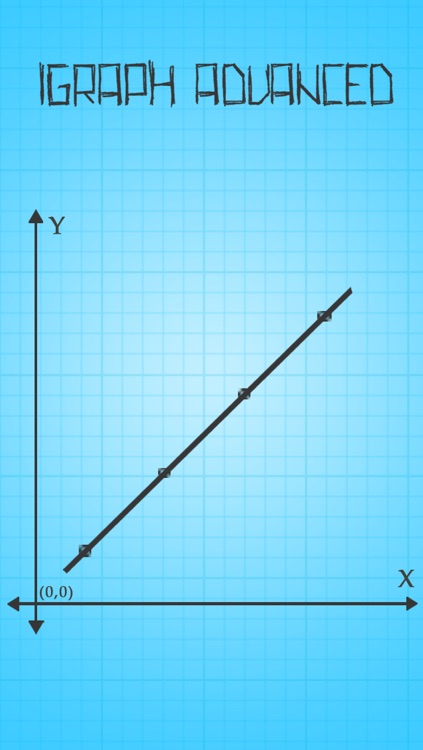
iGraph - Advanced app helps the user to plot and create lines on a graph. A line chart or line graph is a type of chart which displays information as a series of data points connected by straight line segments.
App Screenshots
App Store Description
iGraph - Advanced app helps the user to plot and create lines on a graph. A line chart or line graph is a type of chart which displays information as a series of data points connected by straight line segments.
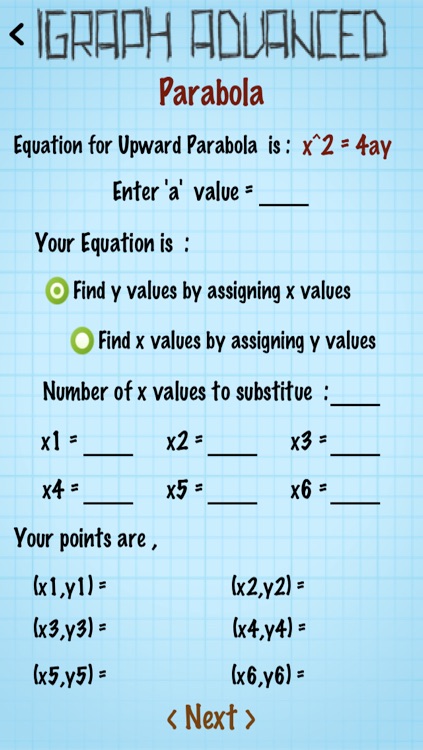
It also gets the inputs for equations such as,
1. Straight Line
2. Parabola
a. Open Upwards
b. Open Downward
c. Open Left
d. Open Right
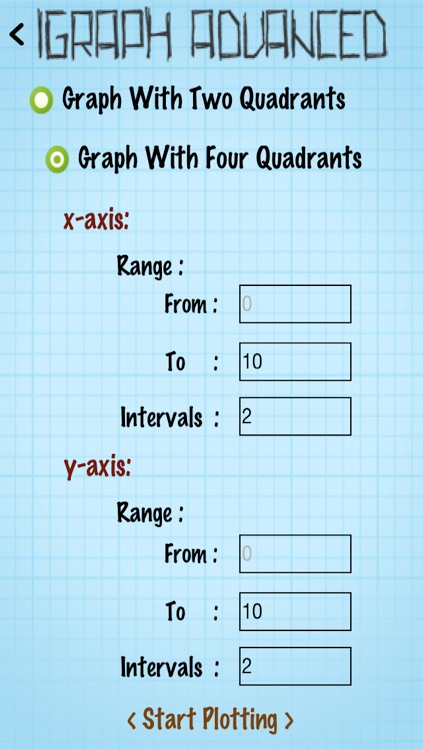
from the user and does the calculation to generate appropriate X & Y coordinates.
It is a type of chart common in many fields. It is similar to a scatter plot except that the measurement points are ordered (typically by their x-axis value) and joined with straight line segments.
A line chart is often used to visualize a trend in data over intervals of time – a time series – thus the line is often drawn chronologically.
Disclaimer:
AppAdvice does not own this application and only provides images and links contained in the iTunes Search API, to help our users find the best apps to download. If you are the developer of this app and would like your information removed, please send a request to takedown@appadvice.com and your information will be removed.
AppAdvice does not own this application and only provides images and links contained in the iTunes Search API, to help our users find the best apps to download. If you are the developer of this app and would like your information removed, please send a request to takedown@appadvice.com and your information will be removed.