You are using an outdated browser. Please
upgrade your browser to improve your experience.

Impos Point of Sale users can enjoy the benefits of the business intelligence software and reporting tool, Impos Analytics

Impos Analytics
by ImPOS


What is it about?
Impos Point of Sale users can enjoy the benefits of the business intelligence software and reporting tool, Impos Analytics.
App Store Description
Impos Point of Sale users can enjoy the benefits of the business intelligence software and reporting tool, Impos Analytics.
Impos Analytics is easy to use and helps Impos clients make smarter business decisions by providing better sales data. Its reporting dashboard lets you visualise your data in rich graphical charts and is configurable so it’s intuitive to you. Reports are generated in a snap, whenever you need them, meaning you don’t have to wait until the end of the day to check your profits. Exporting reports is done with the click of a button, and you can schedule them to be delivered to you by email for a time that suits you.
Impos Analytics lets you stay on top of your numbers even when you’re away from your venue, giving you 24/7 control and peace of mind that things are running smoothly. You can also customise your reporting so it’s more meaningful to your business. Create custom reports, create relationships between report groups, and design your own charts that provide you with the information that you need to manage your business. Drill down to even the smallest details to see where need to make changes or tighten up on costs.
Impos Analytics lets you stay on top of your business like never before.
How Impos Analytics works
When you log in you’ll get instant access to your Daily Dashboard, where you can see all the reports necessary to give you an overview of the day’s trade. You can use the dashboard’s data filters to change the date range, or view another venue.
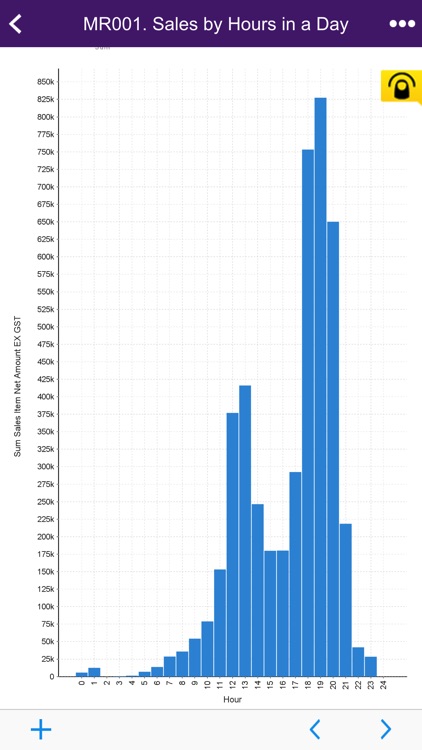
You can drill down into each report to see the data behind the chart, and get charts of individual pieces of data at the lowest level. Creating your own report is just as easy with all the tools you need available from your dashboard.
To view reports on your smartphone just download the Impos Analytics app, login, and access your Dashboard.
Impos Analytics is easy to use, and gives you the reporting power you need right at your fingertips.
Disclaimer:
AppAdvice does not own this application and only provides images and links contained in the iTunes Search API, to help our users find the best apps to download. If you are the developer of this app and would like your information removed, please send a request to takedown@appadvice.com and your information will be removed.
AppAdvice does not own this application and only provides images and links contained in the iTunes Search API, to help our users find the best apps to download. If you are the developer of this app and would like your information removed, please send a request to takedown@appadvice.com and your information will be removed.