You are using an outdated browser. Please
upgrade your browser to improve your experience.

In probability and statistics, the Log Series Distribution is a discrete probability distribution derived from the Maclaurin series expansion

Log Series Distribution
by Donald Schaefer


Log Series Distribution Offers Apple Watch App
Check the details on WatchAware
Check the details on WatchAware
What is it about?
In probability and statistics, the Log Series Distribution is a discrete probability distribution derived from the Maclaurin series expansion.
App Screenshots
App Store Description
In probability and statistics, the Log Series Distribution is a discrete probability distribution derived from the Maclaurin series expansion.
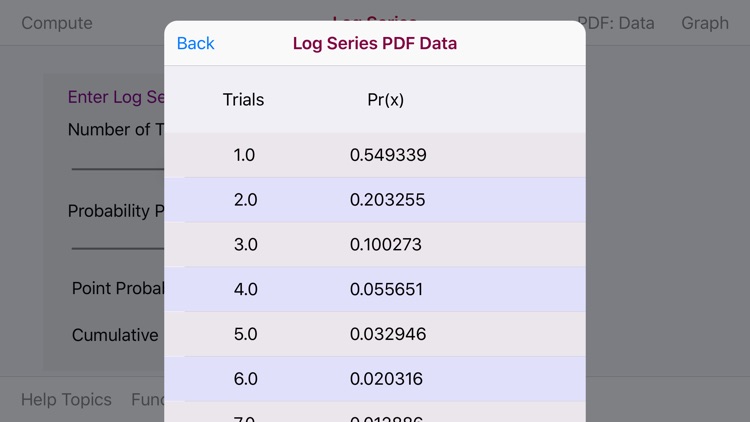
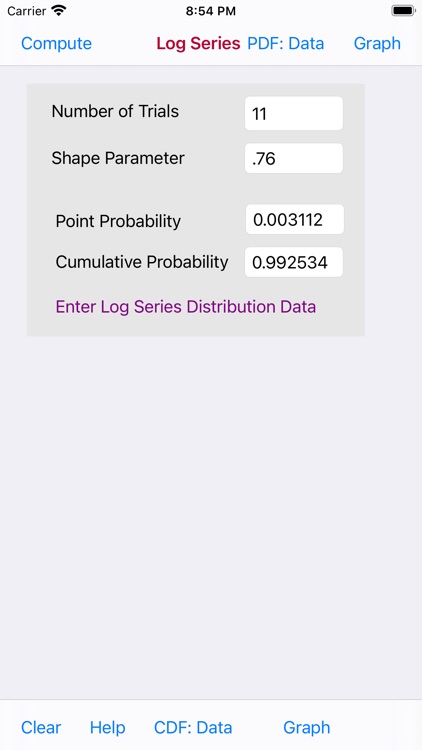
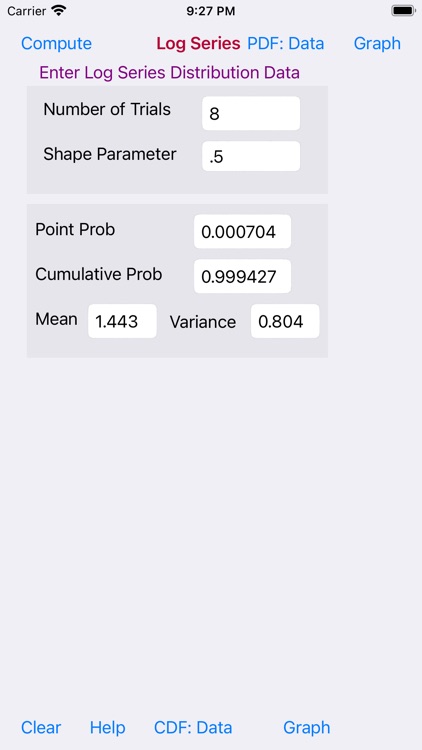
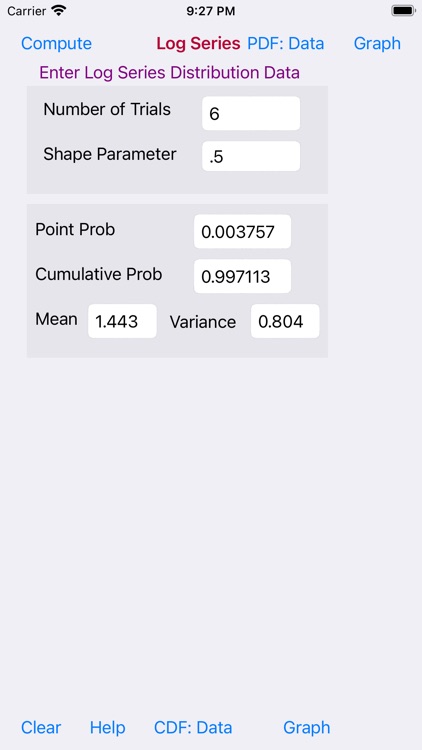
The Log Series Distribution app provides for the data entry of two variables: Number of Trials and a Probability Parameter. The range for the Number of Trials variable is 1.0 - 12.0 and the range of the Probability Parameter is 0.01 - 0.99.
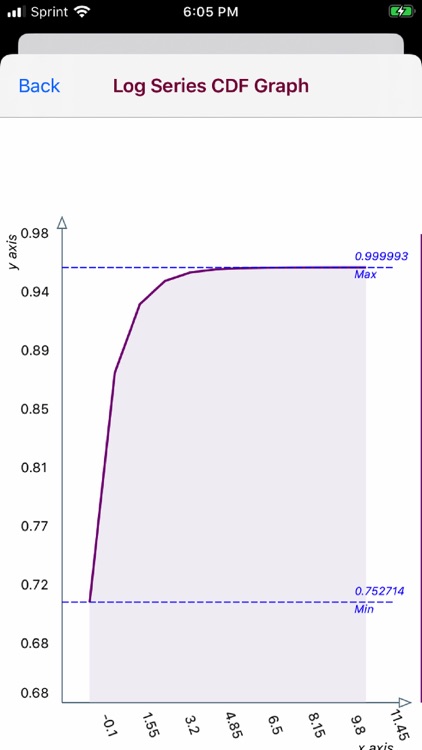
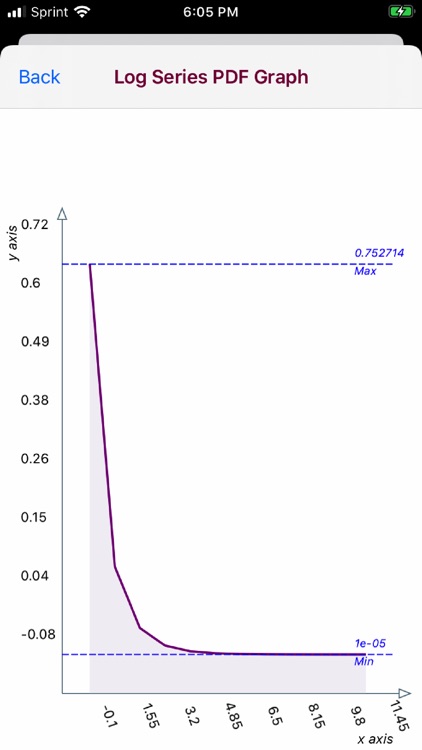
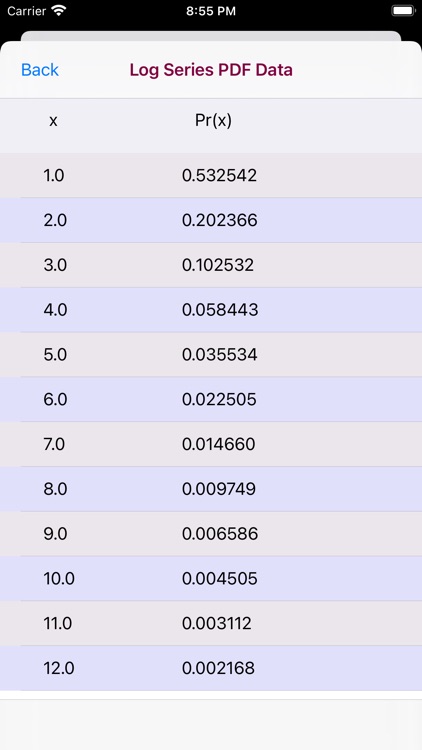
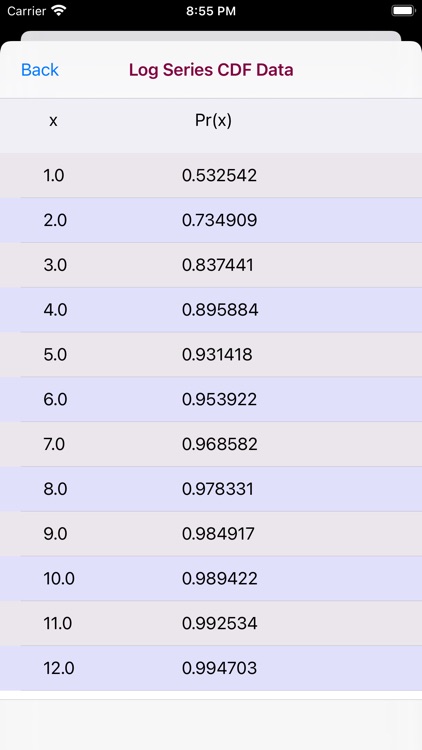
The Log Series Distribution app produces a PDF/CDF Graph and PDF/CDF Data Tables The Number of Trials and Probability Parameter variables selected are used to compute the PDF/CDF data.
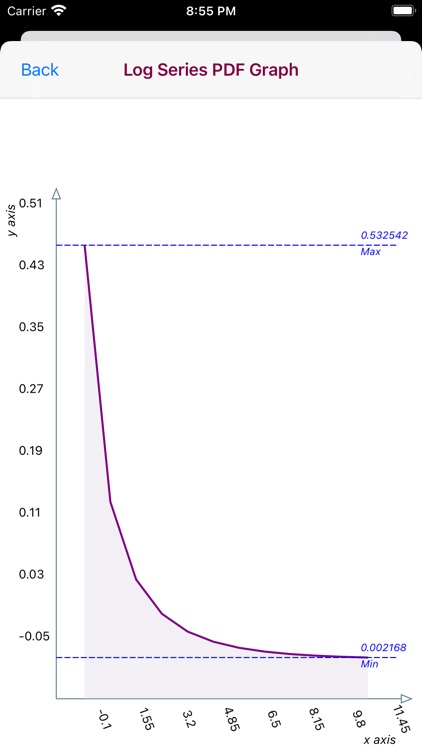
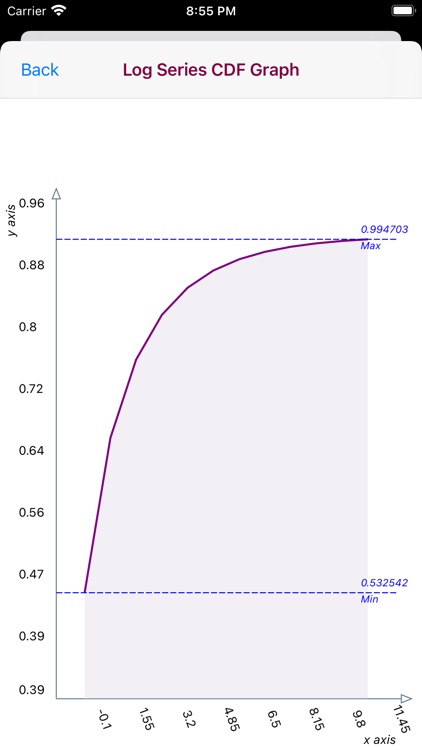
The PDF and CDF graphs are touch interactive graphs for computed (x/Pr(x) paired values. The graphs hav a touch feature whereby upon the touch a slidable vertical line appears. Upon movement of the line a paired (x,Pr(x) values appear relative to the line position on the graph curve.
The horizontal x-axis displays computed (x) values. The vertical y-axis plots a range of Pr(X) values.
Horizontal Max and Min dashed lines display the Maximum and Minimum Pr(x) values
Disclaimer:
AppAdvice does not own this application and only provides images and links contained in the iTunes Search API, to help our users find the best apps to download. If you are the developer of this app and would like your information removed, please send a request to takedown@appadvice.com and your information will be removed.
AppAdvice does not own this application and only provides images and links contained in the iTunes Search API, to help our users find the best apps to download. If you are the developer of this app and would like your information removed, please send a request to takedown@appadvice.com and your information will be removed.