You are using an outdated browser. Please
upgrade your browser to improve your experience.

Don't just multiply volatility by root(t), do a monte carlo study and cover the extreme bases

MCarloRisk3D
by differential enterprises

What is it about?
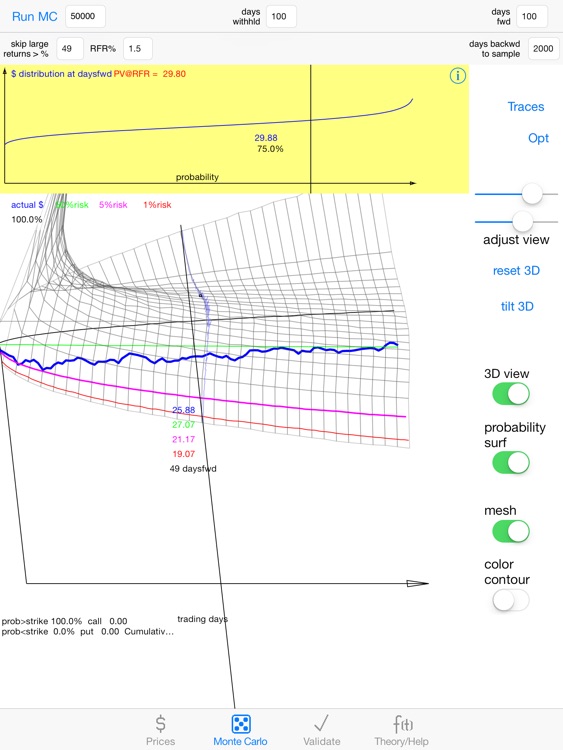
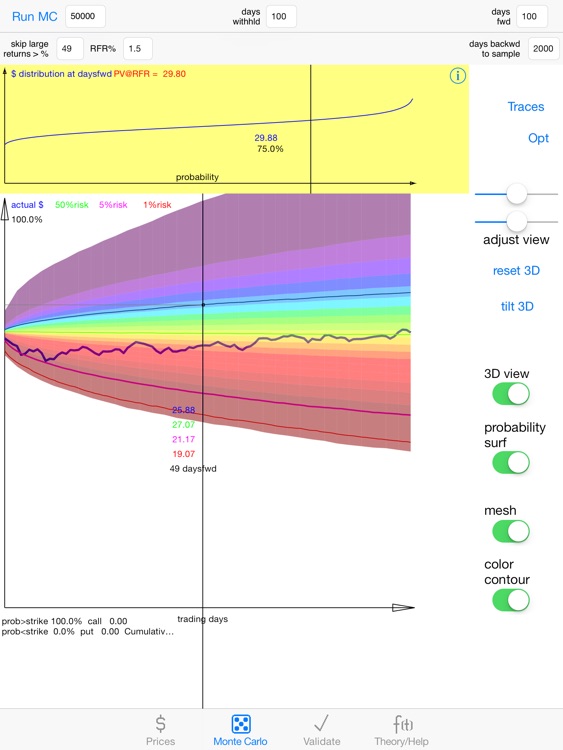
Don't just multiply volatility by root(t), do a monte carlo study and cover the extreme bases. Give the symbol-pushers a run for their money. Can your equation throw in random, out of the ordinary shocks of different magnitude and probability? Well, this app can. MCarloRisk3D: with 3D viewing options for better understanding of the estimated probability surface.
App Screenshots


App Store Description
Don't just multiply volatility by root(t), do a monte carlo study and cover the extreme bases. Give the symbol-pushers a run for their money. Can your equation throw in random, out of the ordinary shocks of different magnitude and probability? Well, this app can. MCarloRisk3D: with 3D viewing options for better understanding of the estimated probability surface.
Now with price data feeds for the highest market cap crypto coins: BTC, Ethereum, Ripple, Litecoin, ADA, EOS, BitcoinCash.
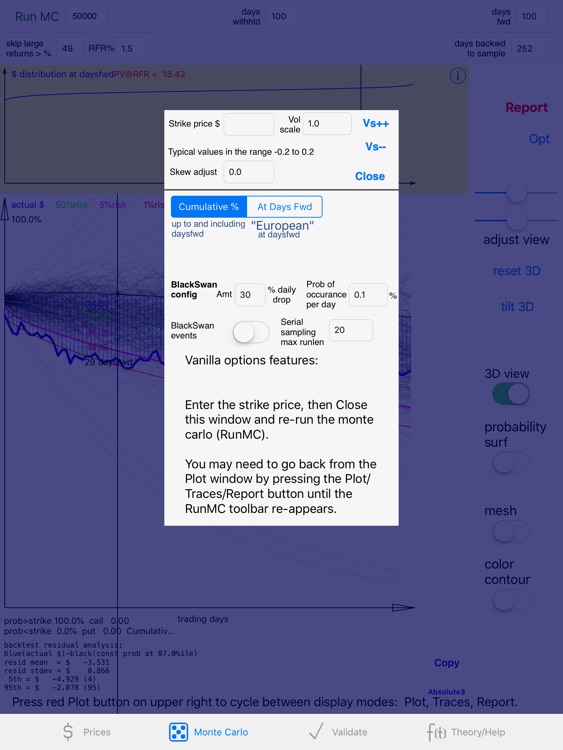
Stock price risk analyzer app for the common man. Now with optional Black Swan events and tunable forward volatility.
Estimates future price distribution using random walk theory.
Background discussion: E. Fama article on early random walk studies from the 1960's:
http://www.ifa.com/Media/Images/PDF%20files/FamaRandomWalk.pdf
New model calibration tutorial:
http://diffent.com/tuning1.pdf
Example use case & training guide for studying "AAPL to $320" can be found at:
http://diffent.com/AAPL320arialP.pdf
The app uses prior data from the stock in question for volatility estimates.
User can control how far back in time to use historical data to capture only the current "epoch" of a company or of the market as a whole if desired.
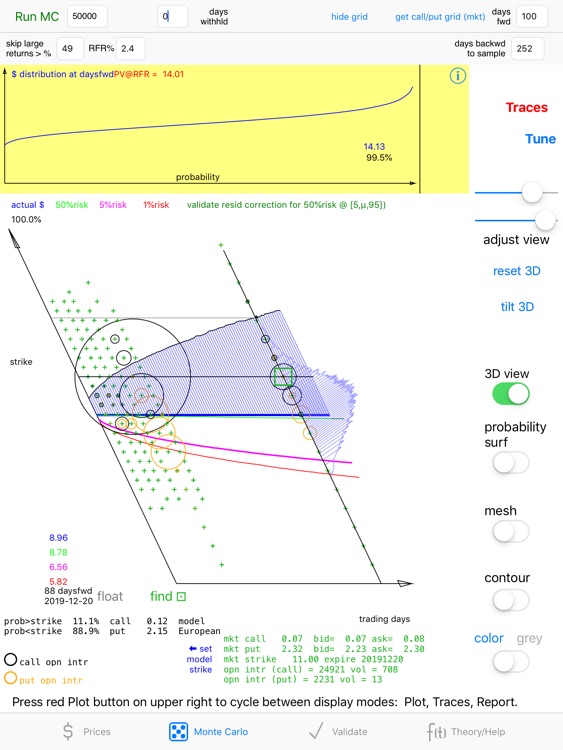
Built-in backtesting, verification, and model tuning tools.
-- Details --
This app models daily stock returns as a stable stochastic process and estimates a future price distribution by Monte Carlo re-sampling from an "empirical distribution" of a user-specified subset of prior (known) daily returns.
Be sure to press the Run Monte button on the Monte Carlo tab after changing settings or downloading a new data set.
This app downloads historical data from Google Finance as base data to resample. Prices are converted to daily returns [P(t)/P(t-1)] before resampling. The user can choose how far back to resample. By estimating a probability distribution of future prices at the user-specified investment horizon in this manner, we can give risk-of-loss estimates in thumb-rule fashion.
Reports out estimated price and %loss estimates at the commonly used levels of 1st percentile and 5th percentile (1% and 5% risk). Also reports out median (50th percentile) price estimates at the given number of days forward. Calculations are performed on daily Closing price data. An artificial shock filter is provided, which can be used to reject the resampling of prior returns that are artificially large (due to splits or other artificial re-valuations that do not affect the underlying value of the asset).
The stochastic model may be tuned or calibrated only by adjusting the maximum number of days backwards to sample or adjusting the black swan parameters.
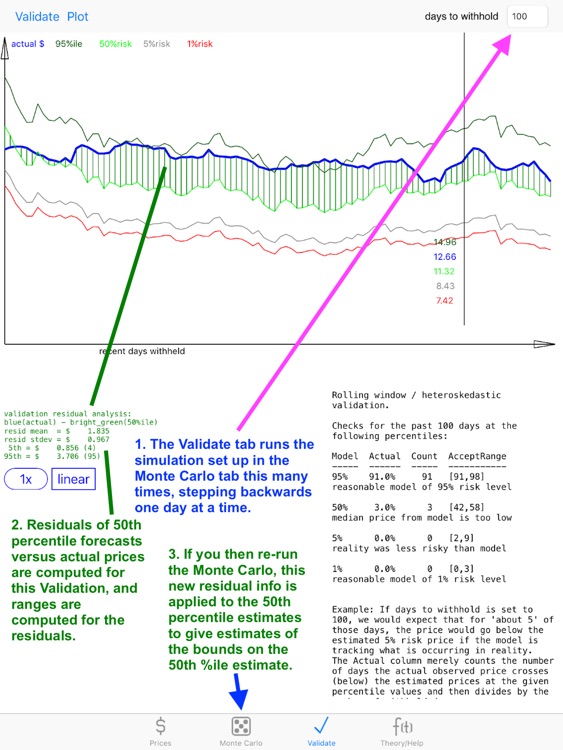
Model Validation features:
On the Monte Carlo tab, you can withhold any number of recent days from the model and then plot the results of the stochastic risk forecast as lower-bound envelopes at 1% and %5 estimated probability (risk) levels.
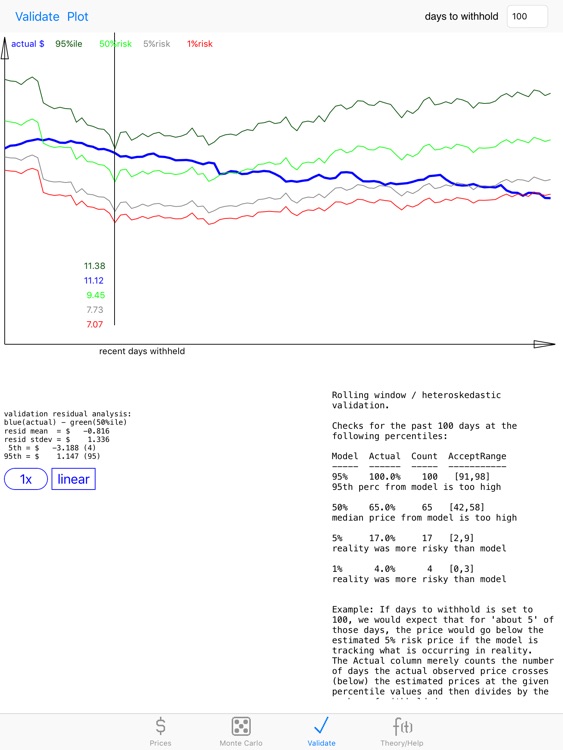
Validate tab:
This allows you to perform an exhaustive validation on your model by withholding several points, computing the model, comparing the forward prediction of the model versus the actual reserved data, and repeating this in increasing time sequence for all withheld points.
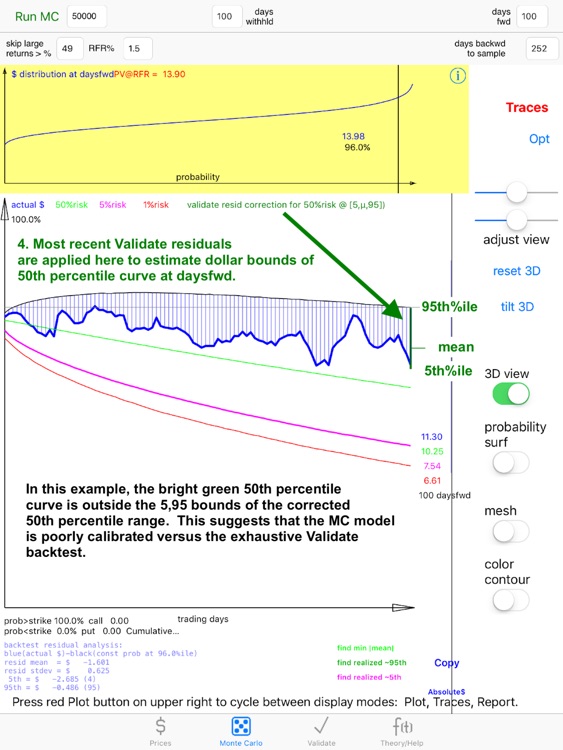
A vertical "Cursor Beam" is provided that you can drag across the new plots in the Monte Carlo tab and the Validate tab to show the plotted values from several curves at once, with the values color-coded to the curves.
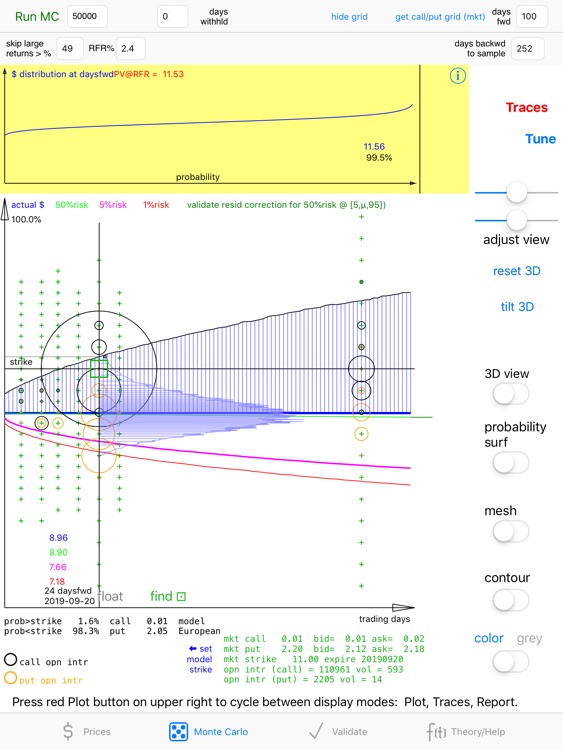
Show the full price probability plot linked to the days-forward setting of the Monte Carlo graph. This is a slice thru the probability surface generated by the Monte Carlo procedure.
The app provider makes no claims as to the suitability of this app for any purpose whatsoever, and the user should consult an investment advisor before making investment decisions.
Disclaimer:
AppAdvice does not own this application and only provides images and links contained in the iTunes Search API, to help our users find the best apps to download. If you are the developer of this app and would like your information removed, please send a request to takedown@appadvice.com and your information will be removed.
AppAdvice does not own this application and only provides images and links contained in the iTunes Search API, to help our users find the best apps to download. If you are the developer of this app and would like your information removed, please send a request to takedown@appadvice.com and your information will be removed.