You are using an outdated browser. Please
upgrade your browser to improve your experience.
Display RAOB upper air data in a SkewT, Tephigram, or Stuve chart

Raob
by Paul Flatt
What is it about?
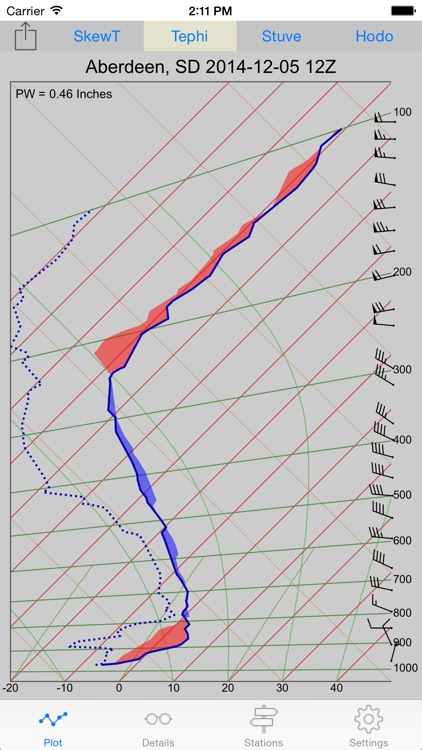
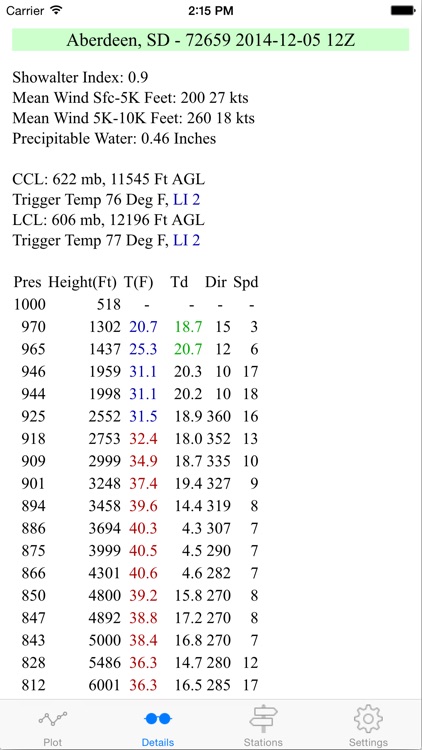
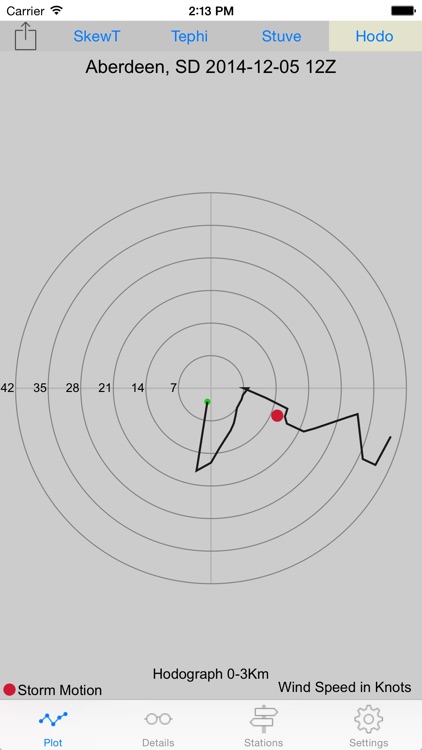
Display RAOB upper air data in a SkewT, Tephigram, or Stuve chart. Zoom the scale to see detail about inversion strength and height.
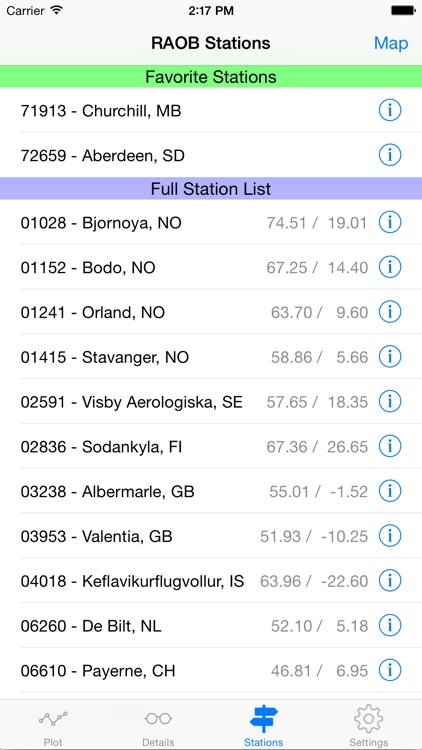
App Screenshots
App Store Description
Display RAOB upper air data in a SkewT, Tephigram, or Stuve chart. Zoom the scale to see detail about inversion strength and height.
Collect data for consecutive cycles and show 12 or 24 hour temperature changes. Positive temperature changes shown in light red, negative changes shown in light blue.
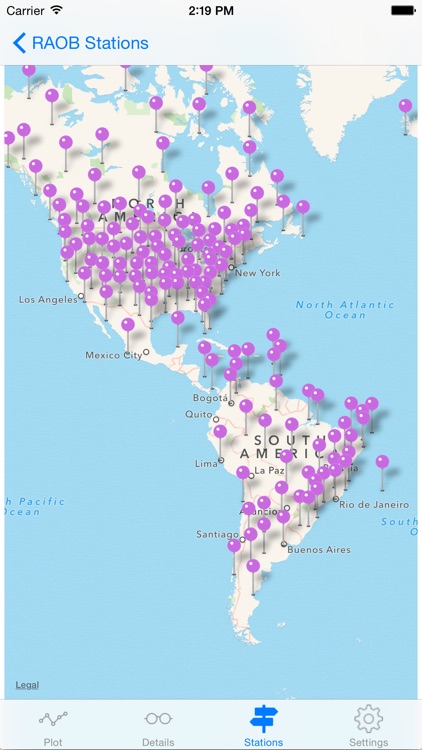
Aircraft pilots, balloonists, and soaring pilots can monitor upper air data at the nearest upper air station to help with flight planning.
Disclaimer:
AppAdvice does not own this application and only provides images and links contained in the iTunes Search API, to help our users find the best apps to download. If you are the developer of this app and would like your information removed, please send a request to takedown@appadvice.com and your information will be removed.
AppAdvice does not own this application and only provides images and links contained in the iTunes Search API, to help our users find the best apps to download. If you are the developer of this app and would like your information removed, please send a request to takedown@appadvice.com and your information will be removed.