You are using an outdated browser. Please
upgrade your browser to improve your experience.

By using iPhone camera, you can measure a spectral intensity of the light by a spectrum image from a spectrometer

SpectralViewer, spectraView
by Junichi Watanabe
What is it about?
By using iPhone camera, you can measure a spectral intensity of the light by a spectrum image from a spectrometer.
App Screenshots
App Store Description
By using iPhone camera, you can measure a spectral intensity of the light by a spectrum image from a spectrometer.
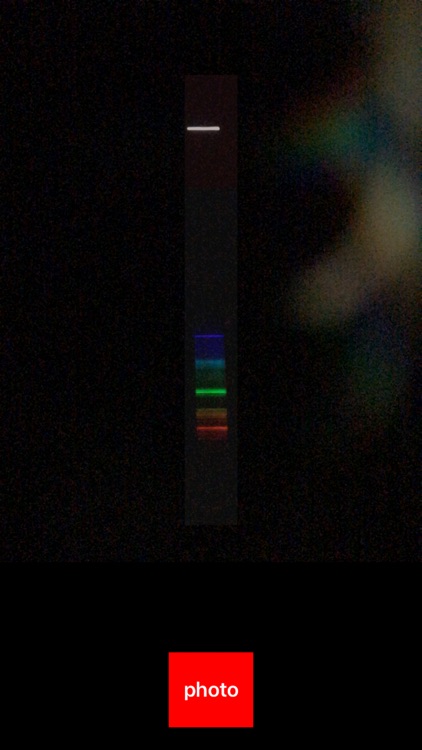
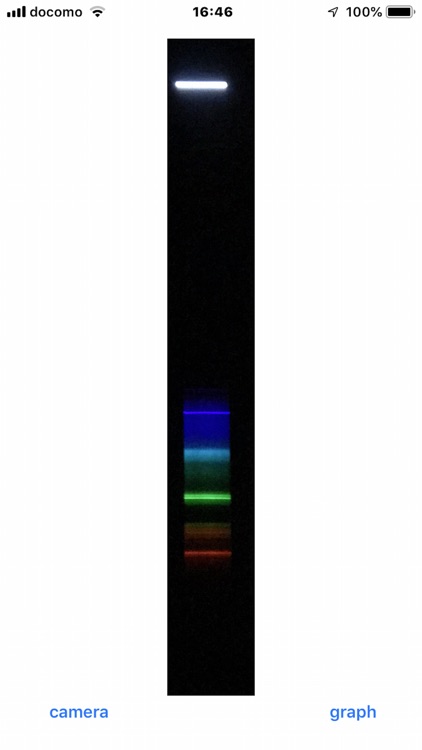
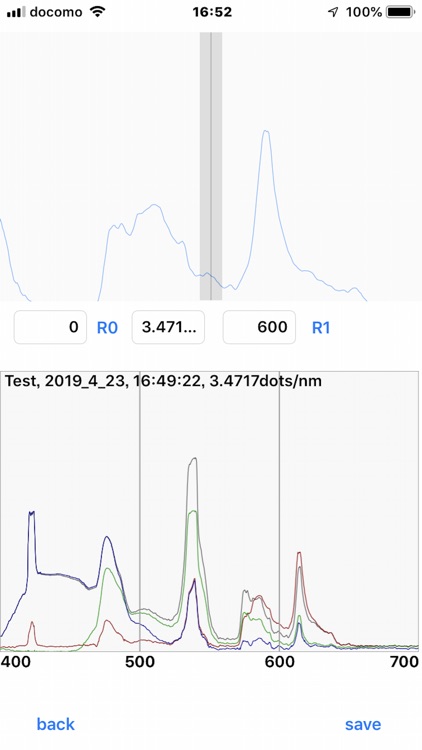
Press camera > photo button to shoot a spectrum image dispersed by the spectrometer. If reflected light is observed, please be the in the area of the dark rectangle on the upper side of the camera screen.
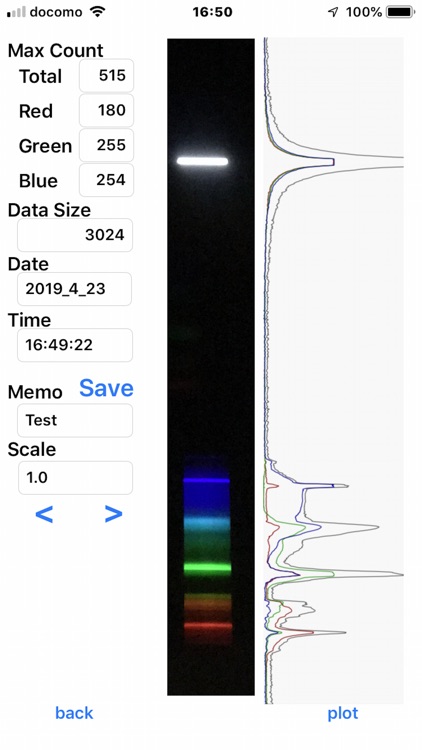
Press the graph button to show the light intensity distribution of the spectrum calculated by the camera image. The values of R, G and B are respectively calculated as the average value of the central quarter width of the spectral image. Adjust the intensity of the input light by, for example, narrowing the slit so that each color does not exceed the maximum value 255. The value of R+G+B is also plotted in black. You can change the plot scale of spectral intensity by <> button.
By pressing the plot button, sliding the upper spectral image to the left and right, and entering two points with known wavelengths, you can plot the wavelength scale. If the R0 wavelength is set as reflected light (0 nm) and the R1 wavelength is set only for the first time, the wavelength scale is plotted only by setting the R0 wavelength after the second time. You can save the plot with wavelength scale as image. For the data to be stored, a filter was applied so as to smoothly connect the intensity curves of the sensitivity wavelength regions of R, G and B colors.
Because it is very dangerous, please never see strong light such as the sun, and please do not put it in the iPhone's camera.
Disclaimer:
AppAdvice does not own this application and only provides images and links contained in the iTunes Search API, to help our users find the best apps to download. If you are the developer of this app and would like your information removed, please send a request to takedown@appadvice.com and your information will be removed.
AppAdvice does not own this application and only provides images and links contained in the iTunes Search API, to help our users find the best apps to download. If you are the developer of this app and would like your information removed, please send a request to takedown@appadvice.com and your information will be removed.