You are using an outdated browser. Please
upgrade your browser to improve your experience.

In probability and statistics, Student's t-distribution (or simply the t-distribution) is any member of a family of continuous probability distributions that arises when estimating the mean of a normally distributed population in situations where the sample size is small and population standard deviation is unknown

Student's t Probability
by Donald Schaefer


Student's t Probability Offers Apple Watch App
Check the details on WatchAware
Check the details on WatchAware
What is it about?
In probability and statistics, Student's t-distribution (or simply the t-distribution) is any member of a family of continuous probability distributions that arises when estimating the mean of a normally distributed population in situations where the sample size is small and population standard deviation is unknown.
App Screenshots


App Store Description
In probability and statistics, Student's t-distribution (or simply the t-distribution) is any member of a family of continuous probability distributions that arises when estimating the mean of a normally distributed population in situations where the sample size is small and population standard deviation is unknown.
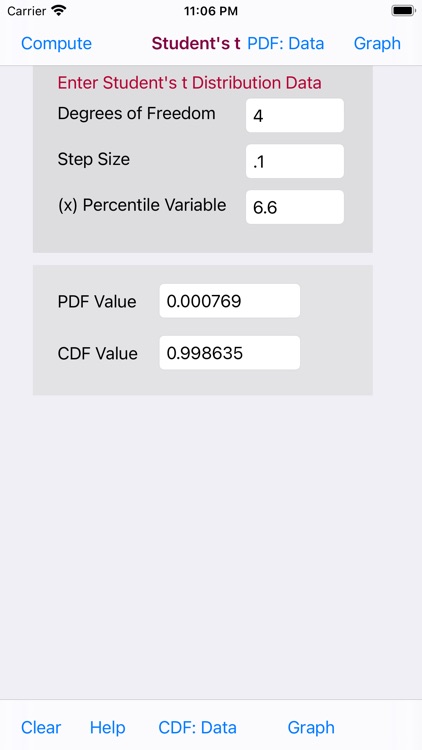
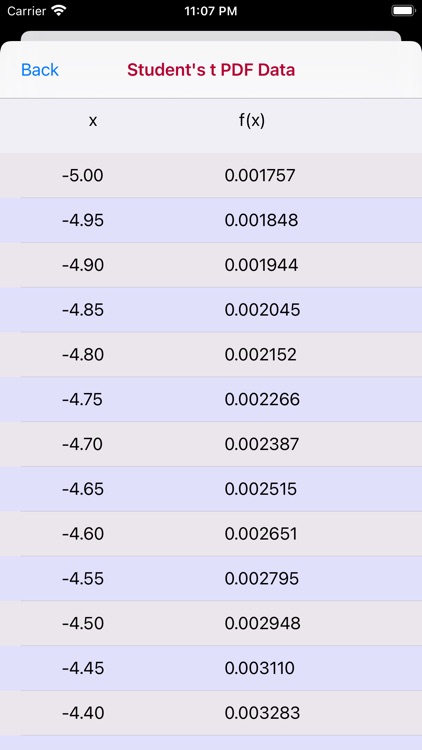
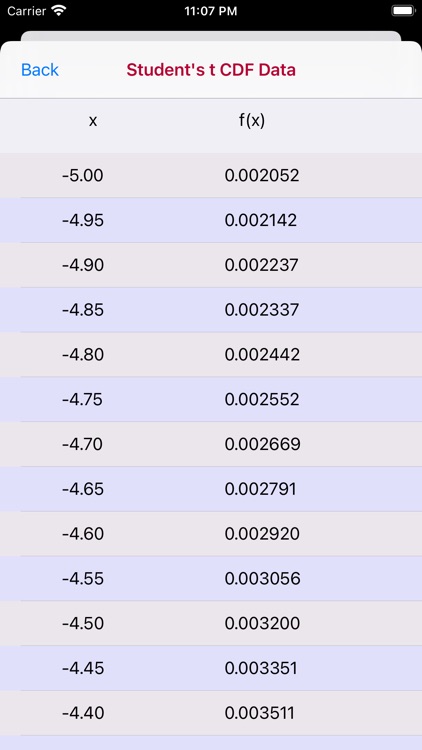
The Student’s t-distribution app has three data input parameters - the Number of Degrees of Freedom (range 2-20), a Step Size parameter for evaluation points for the PDF and CDF Distributions (range 0.5-1.5) and the Number of Steps (range 6-18).
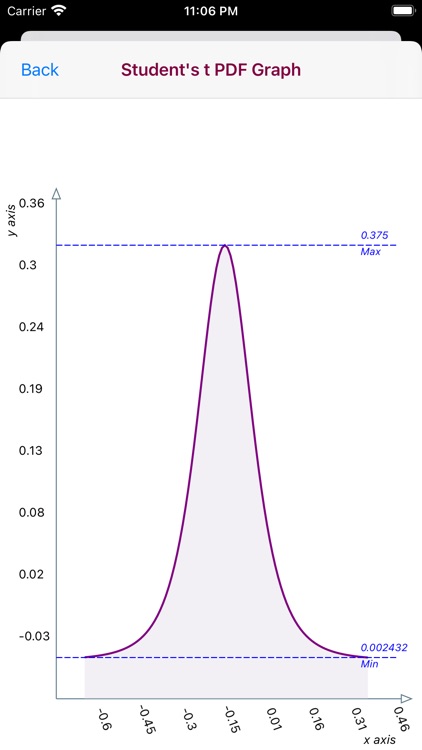
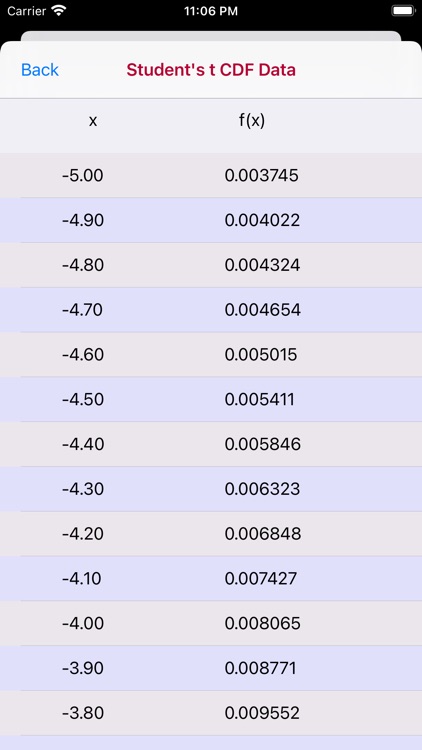
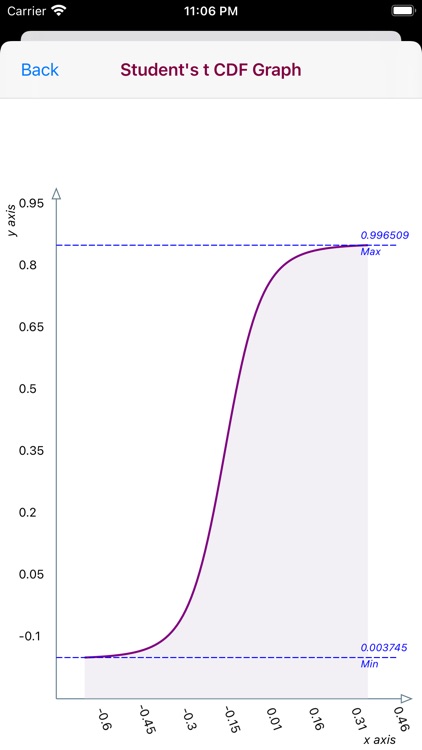
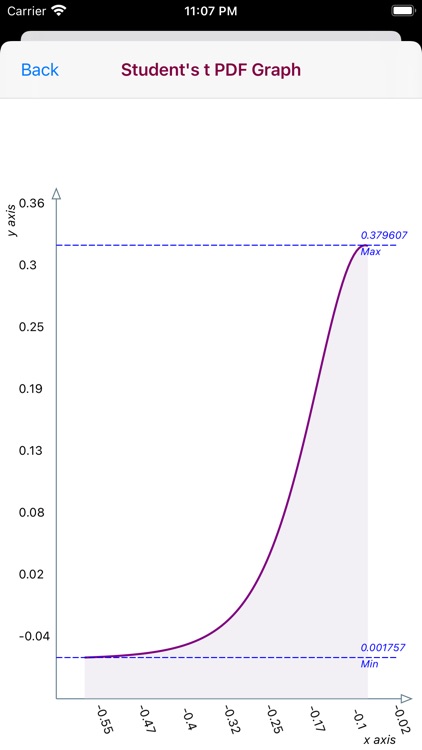
The Student’s t Distribution app also displays a touch enabled graph for the x/f(x) generated values. The graph is touch enabled graph. Upon touching the graph a vertical line appears. Move the vertical line to the left or right to display the point x/f(x).
The horizontal x-axis displays x values. The vertical y-axis plots a range of either the x-increment and y-increment values
Horizontal Max and Min dashed lines display the Maximum and Minimum values.Automatic incrementing of the value.
Disclaimer:
AppAdvice does not own this application and only provides images and links contained in the iTunes Search API, to help our users find the best apps to download. If you are the developer of this app and would like your information removed, please send a request to takedown@appadvice.com and your information will be removed.
AppAdvice does not own this application and only provides images and links contained in the iTunes Search API, to help our users find the best apps to download. If you are the developer of this app and would like your information removed, please send a request to takedown@appadvice.com and your information will be removed.