You are using an outdated browser. Please
upgrade your browser to improve your experience.

Visualizer allows you to create graphics in a new way

The Data Visualizer
by Michael Amling


What is it about?
Visualizer allows you to create graphics in a new way.
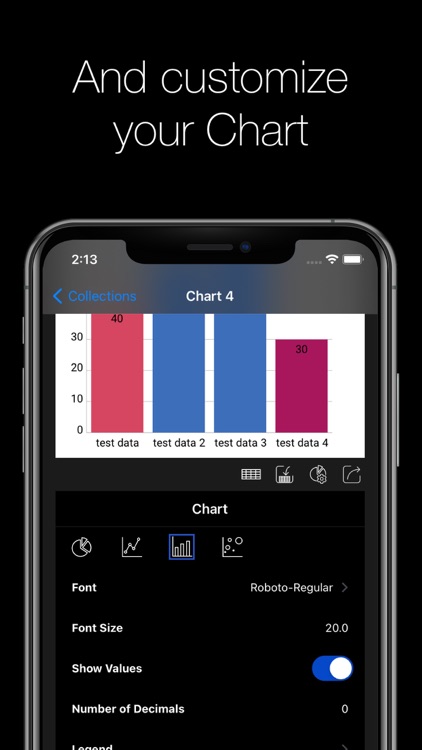
App Screenshots


App Store Description
Visualizer allows you to create graphics in a new way.
By selecting one of the different options in the overview, you can create easy and awesome looking charts.
You can now add the created chart as a widget to your homescreen.
Visualizer support all kind of charts:
- bar charts,
- pie charts,
- line charts
- bubble charts
all of them can be easily edited with the build in spreadsheet.
You can use a CSV file to add a data set.
All charts you create can be exported as JPG or PNG.
Infographer allows to create data visualizations.
This is a pure native app, so all app functionalities are performant and can be used offline.
Disclaimer:
AppAdvice does not own this application and only provides images and links contained in the iTunes Search API, to help our users find the best apps to download. If you are the developer of this app and would like your information removed, please send a request to takedown@appadvice.com and your information will be removed.
AppAdvice does not own this application and only provides images and links contained in the iTunes Search API, to help our users find the best apps to download. If you are the developer of this app and would like your information removed, please send a request to takedown@appadvice.com and your information will be removed.