You are using an outdated browser. Please
upgrade your browser to improve your experience.

The Visual Chart App allows you to monitor the financial markets in REAL TIME and to manage your investment at any time from anywhere

Visual Chart
by Visual Chart Group S.L.
What is it about?
The Visual Chart App allows you to monitor the financial markets in REAL TIME and to manage your investment at any time from anywhere.
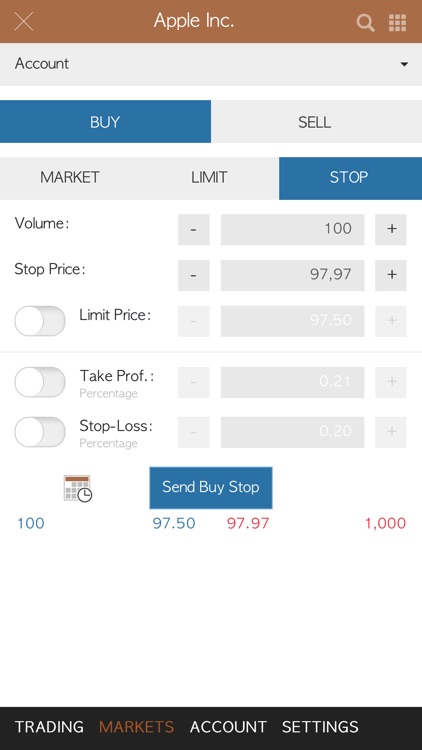
App Screenshots
App Store Description
The Visual Chart App allows you to monitor the financial markets in REAL TIME and to manage your investment at any time from anywhere.
These are its main features.
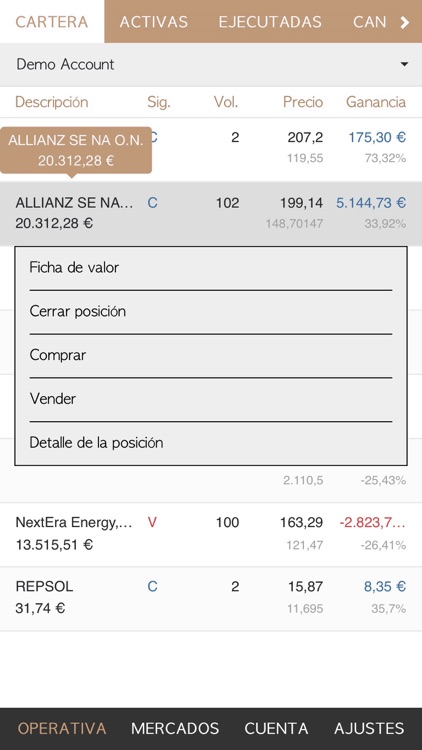
TRADING
With Visual Chart App you can do the following:
- Send market, limit or stop orders.
- Work with advanced orders such as Bracket, OCO, OSO, Trailing Stop, etc., creating entry and exit strategies for the markets.
- Close every open position with a single click.
- Turn the open positions, changing the long into short positions and vice versa.
- Monitor, modify and/or cancel the active orders at the market.
The trading is synchronized with the rest of our platforms. You can open a position at the market, for example, from Visual Chart Professional or Visual Chart Web and close it from Visual Chart App.
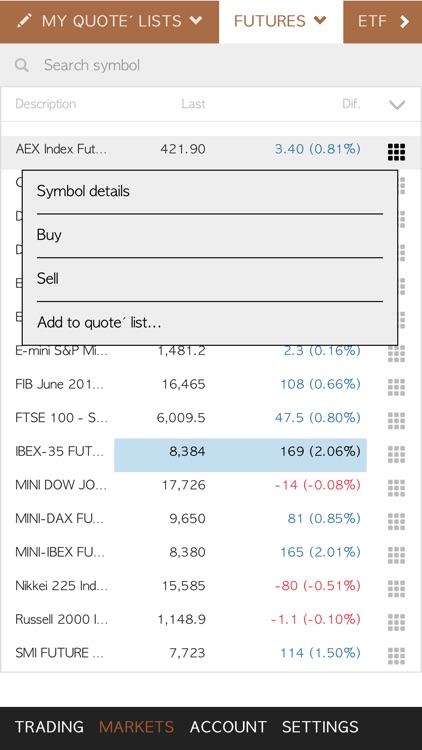
MONITORING OF THE MARKETS
The app also includes the following features:
- Monitoring of the main stocks and futures markets worldwide in REAL TIME.
The demo account offers you the information for 3 days in real time. After this period you can see the end-of-day data forever.
- Creation of the quotes´ lists of your favorite assets for its quick access.
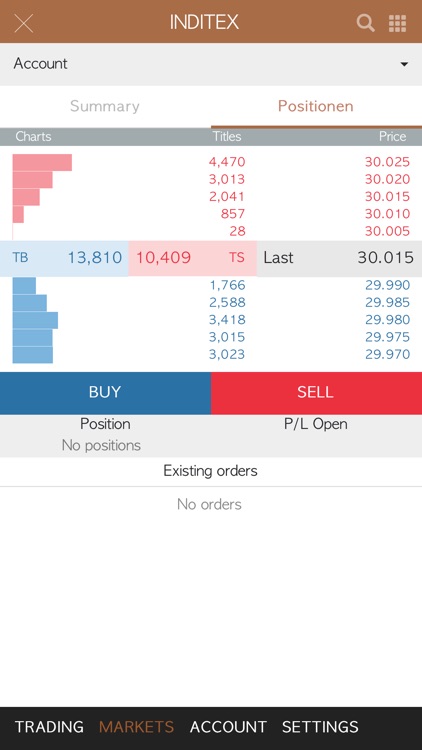
- Verification of the 5 best bid and ask positions, as well as the available volume for each price level of the asset you are monitoring.
INFORMATION ABOUT YOUR ACCOUNT
You can check the following information about your account any time:
- Total equity: available cash, portfolio value and unrealized profits.
- Retained: guarantees and outstanding settlement amount.
- Return on investment: realized and unrealized guarantees.
Download the app for free and register for a 3 days demo account in real time at no cost. After this period you can use the app with end-of-day data forever.
For any further question please visit our website www.visualchart.com or send us an e-mail to support@visualchart.com.
Disclaimer:
AppAdvice does not own this application and only provides images and links contained in the iTunes Search API, to help our users find the best apps to download. If you are the developer of this app and would like your information removed, please send a request to takedown@appadvice.com and your information will be removed.
AppAdvice does not own this application and only provides images and links contained in the iTunes Search API, to help our users find the best apps to download. If you are the developer of this app and would like your information removed, please send a request to takedown@appadvice.com and your information will be removed.