Review: Analytics App
by Robb Lewis
April 20, 2010
Overview
If you run a website, chances are you want to track the amount of visitors and how their getting to your site. Google Analaytics is a great way to track data from your website and Analytics App allows you to see your Google Analytics stats right from your iPhone. You can see an overview for multiple accounts and sites of today, yesterday, the past month, as well as drill down to specifics such as browser version, OS version and location.Features
 - 55 different reports
- Multiple accounts
- Adsense support
- Secure connection to Google Analytics
- Customisable date range
The first thing you need to do to get to your website stats is input your Google Anlaytics login credentials. Analytics App allows you to access multiple accounts (if you have more than one). Once this is done, your ready to start digging.
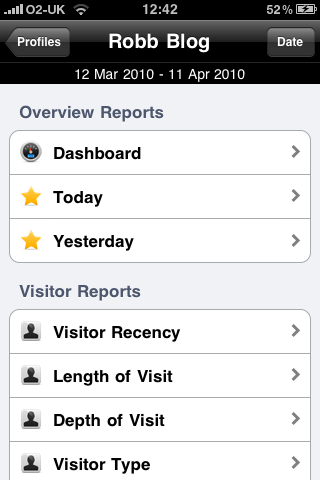
The main screen will show a list of websites associated with the account you are logged into. Select the website you want to see and you will be presented with a list of three different overview reports to look at; dashboard, today and yesterday. The dashboard shows a line graph of visitors to your site as well as visits, page views, average time on site, bounce rate and average page views. Scrolling down shows details of keywords that got visitors to your site, which pages people have looked at, what a visitors location was, as well as which sites they were on before yours.
The today and yesterday overviews show the same stats
- 55 different reports
- Multiple accounts
- Adsense support
- Secure connection to Google Analytics
- Customisable date range
The first thing you need to do to get to your website stats is input your Google Anlaytics login credentials. Analytics App allows you to access multiple accounts (if you have more than one). Once this is done, your ready to start digging.
The main screen will show a list of websites associated with the account you are logged into. Select the website you want to see and you will be presented with a list of three different overview reports to look at; dashboard, today and yesterday. The dashboard shows a line graph of visitors to your site as well as visits, page views, average time on site, bounce rate and average page views. Scrolling down shows details of keywords that got visitors to your site, which pages people have looked at, what a visitors location was, as well as which sites they were on before yours.
The today and yesterday overviews show the same stats  as the dashboard view, but (obviously) specific to the day they correspond to. From the main screen, you can select specific dates to see stats for, simple by pressing the date button and chooses the time range.
Below the overview reports are options for far more specific reports such as visitor location, browser and operating system type and version number, flash version, java enabled, connection speed and many more. These options give you quick access to any data you need and each overview page can be seen by numbers, or by percentage. There are also traffic, content and site search reports; basically anything available on the Google Analytics page, is available in this app.
as the dashboard view, but (obviously) specific to the day they correspond to. From the main screen, you can select specific dates to see stats for, simple by pressing the date button and chooses the time range.
Below the overview reports are options for far more specific reports such as visitor location, browser and operating system type and version number, flash version, java enabled, connection speed and many more. These options give you quick access to any data you need and each overview page can be seen by numbers, or by percentage. There are also traffic, content and site search reports; basically anything available on the Google Analytics page, is available in this app.
The Breakdown
The Good: Analytics app offers everything the full Google site does, in an easy to use interface. Every bit of information can be swapped between actual numbers and percentages and being able to see information for exact dates is excellent. The yesterday overview report is something that even the Google Analytics page doesn't offer and multiple account support is great for those who are tracking more than one site. The Bad: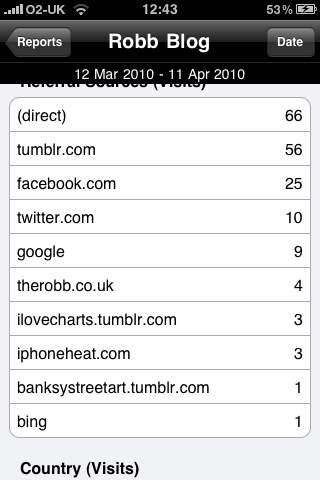 Although you have access to everything you need with Analytics App, getting to it can be slow. After the initial loading of your account, selecting a report will cause the app to start loading the stats. Obviously, I realise the app need to load the information, but it would be far better if data was loaded on startup rather than for each report. Switching between different reports becomes tedious very quickly, especially if you're on a slow network.
Also, there is only one graph ever shown and that is on the overview report. I would like to be able to see more specific graphs and charts, like you can on the Google Analytics site.
Although you have access to everything you need with Analytics App, getting to it can be slow. After the initial loading of your account, selecting a report will cause the app to start loading the stats. Obviously, I realise the app need to load the information, but it would be far better if data was loaded on startup rather than for each report. Switching between different reports becomes tedious very quickly, especially if you're on a slow network.
Also, there is only one graph ever shown and that is on the overview report. I would like to be able to see more specific graphs and charts, like you can on the Google Analytics site.