You are using an outdated browser. Please
upgrade your browser to improve your experience.

This app includes statistical methods for:

Art of Stat: Explore Data
by Bernhard Klingenberg

What is it about?
This app includes statistical methods for:
App Screenshots

App Store Description
This app includes statistical methods for:
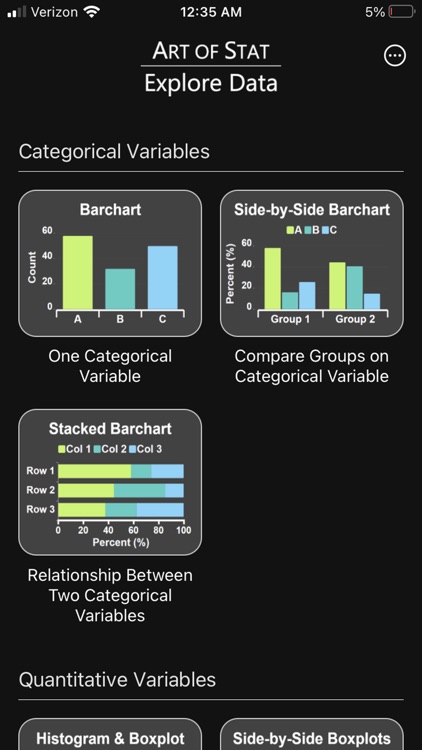
- Analyzing One Categorical Variable
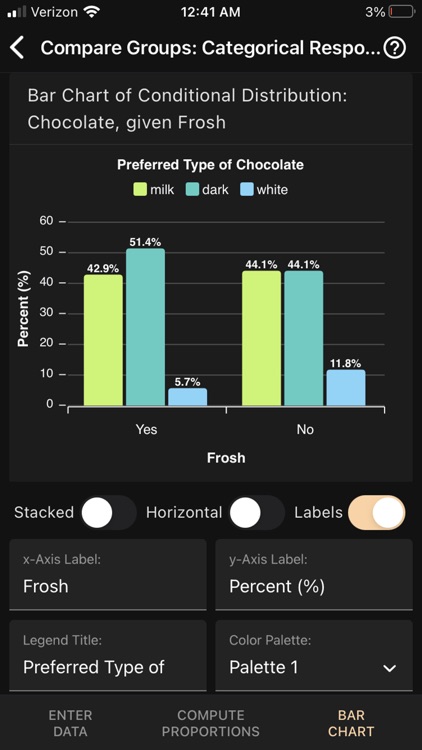
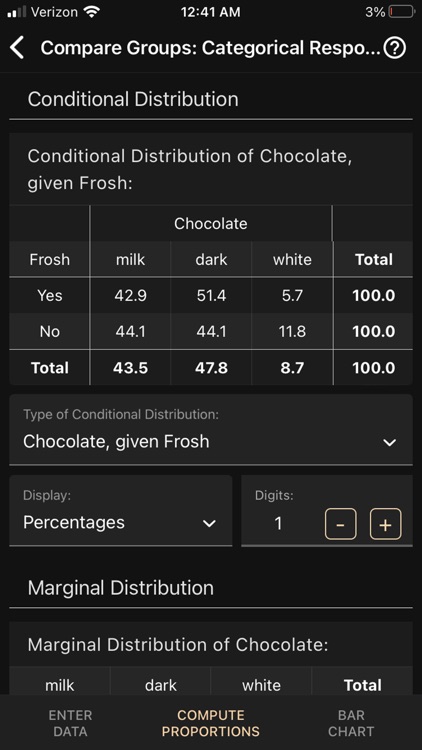
- Comparing Groups on a Categorical Variable
- Analyzing the Relationship Between Two Categorical Variables
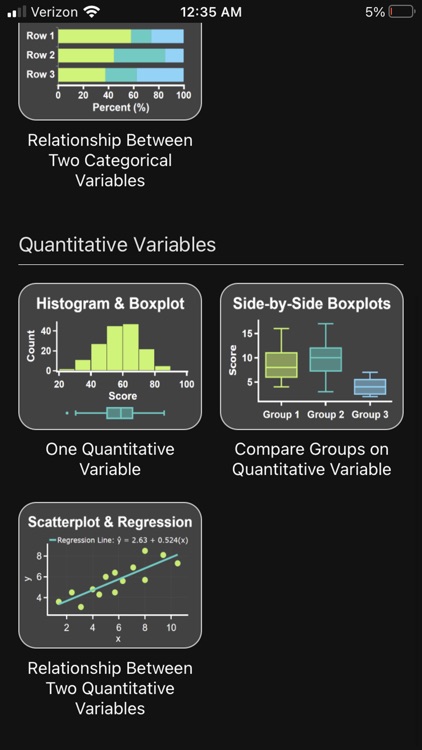
- Analyzing One Quantitative Variable
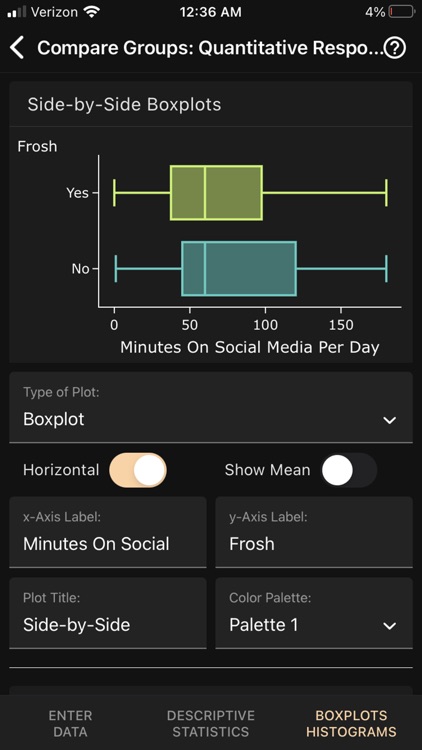
- Comparing Groups on a Quantitative Variable
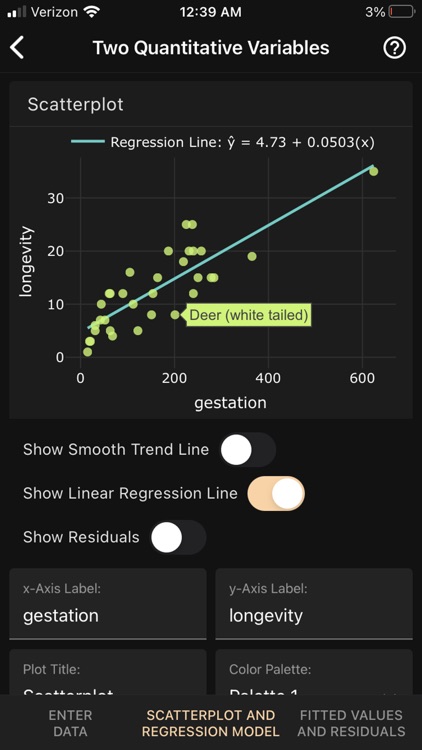
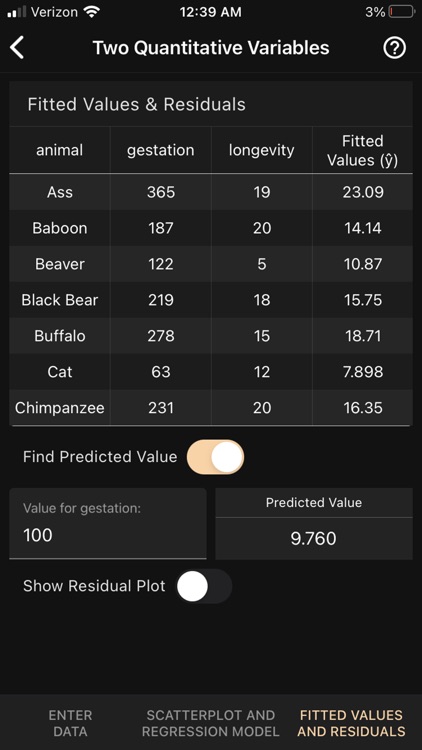
- Analyzing the Relationship Between Two Quantitative Variables (Linear Regression)
You can type in your own data or, more conveniently, copy & paste data from a spreadsheet app such as Google Sheets, Excel or Apple’s Numbers app. Alternatively, upload your own CSV file (which any spreadsheet program can create) into the app and select the variables from its columns.
Obtain descriptive statistics and graphs to explore your data:
- Frequency tables and bar and pie charts for exploring one categorical variable.
- Contingency tables, conditional proportions and side-by-side or stacked bar charts for exploring a categorical variable across several groups or the association between two categorical variables.
- Mean, standard deviation and the 5-number summary together with histograms and boxplots to explore a quantitative variable.
- Side-by-side boxplots, stacked histograms or density plots for comparing a quantitative variable across several groups.
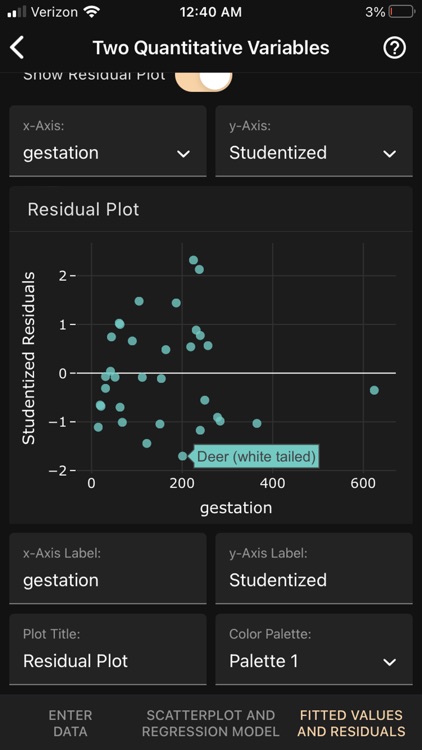
- Interactive scatterplots with smooth and regression lines to analyze the relationship between two quantitative variables. Correlation statistics and linear regression parameters and predictions. Plots of raw and studentized residuals.
The app comes with two example datasets preloaded. One is a random sample of students taking an intro stats class at Williams College, the other is a dataset on longevity and other characteristics of mammals (Source: https://genomics.senescence.info/species/index.html). The app creates a folder called "Art of Stat: Explore Data" on your phone that contains these two CSV files. You can also upload your own datasets to this folder by simply sending the csv file as e.g., an email attachment and then saving it to this or any other folder.
Disclaimer:
AppAdvice does not own this application and only provides images and links contained in the iTunes Search API, to help our users find the best apps to download. If you are the developer of this app and would like your information removed, please send a request to takedown@appadvice.com and your information will be removed.
AppAdvice does not own this application and only provides images and links contained in the iTunes Search API, to help our users find the best apps to download. If you are the developer of this app and would like your information removed, please send a request to takedown@appadvice.com and your information will be removed.