You are using an outdated browser. Please
upgrade your browser to improve your experience.
Explore and analyze your datasets

Data Explorer
by A&X Analytics, LLC

What is it about?
Explore and analyze your datasets. Find patterns within and between variables.
Data Explorer is $9.99 but there are more add-ons
-
$9.99
Full Version
-
$2.99
Bivariate Analysis
-
$2.99
Linear and Logistic Regression
-
$1.99
Two-way table with Chi-Squared
-
$2.99
ANOVA
-
$1.99
Hypothesis Test of Means
-
$0.99
Add Variable
App Screenshots
App Store Description
Explore and analyze your datasets. Find patterns within and between variables.
Use industry standard statistical techniques without being a stats expert. Get plain english explanations.
Data Explorer makes the world of data analysis accessible to the rest of us.
Features include::
• Import data files (csv, txt, xls, xlsx)
• Enter / edit data by hand
• Browse your data set. Apply filters to zero in on the rows that interest you.
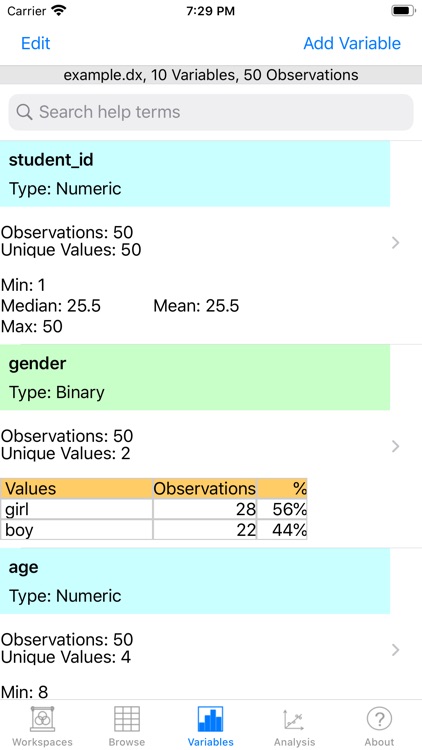
• Get key stats on each variable and see a graph of its distribution
• Variables can be numerical, categorical, or date / time.
• Hypothesis tests of means and proportions. One, two, and paired samples.
• Two way frequency tables of what values categorical variables take, including phi and Cramer's V statistics
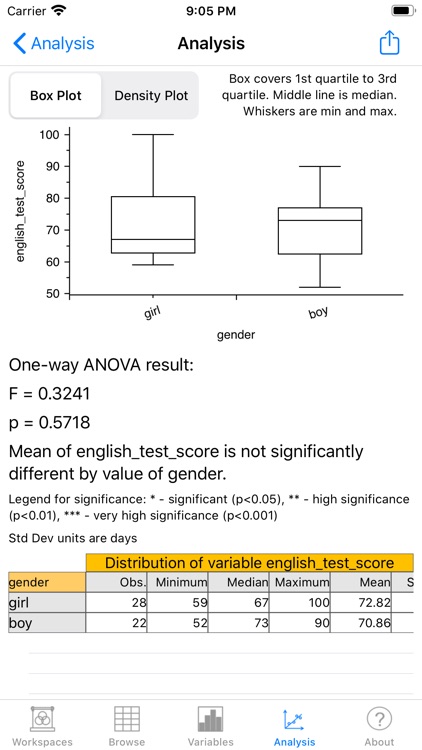
• See the distribution of a numerical variables broken down by levels of a categorical variable, including one-way ANOVA, box plot, and density plot
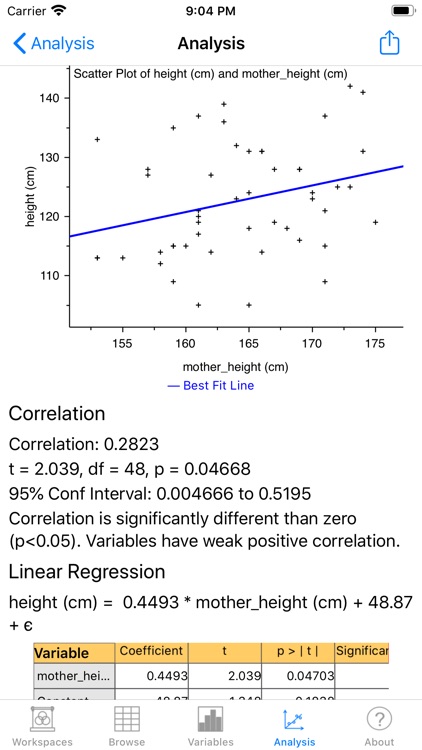
• See how two numerical variables vary with each other (correlation)
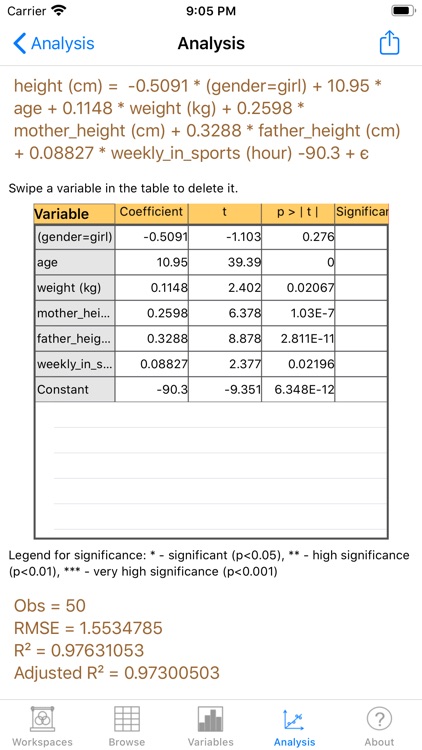
• Explain how one numerical variable varies by a combination of other numerical variables (linear and logistic regression)
• Variable transformations. Calculate squares, logs, and other commonly used transformation for use in your regressions and correlations
All analysis include:
• Results are given in statistical terms and also in plain english
• Put as many filters as you want on each analysis to focus in on the part of your data you're interested in
Accepts data input in the following formats:
• enter data by hand while in the field
• import comma separated files (.csv)
• import tab delimited text files (.txt)
• import excel files (xls and xlsx)
• Current version limited to 100,000 rows and 500 columns to be conservative about performance.
Export options:
• Email PDFs and CSVs of variable summaries and analysis results
• Print variable summaries and analysis results
• Email CSV of datasets you've entered or edited
We are actively developing this app and have additional features lined up. Your feedback can influence the priority we put on different features so please let us know what matters to you!
Disclaimer:
AppAdvice does not own this application and only provides images and links contained in the iTunes Search API, to help our users find the best apps to download. If you are the developer of this app and would like your information removed, please send a request to takedown@appadvice.com and your information will be removed.
AppAdvice does not own this application and only provides images and links contained in the iTunes Search API, to help our users find the best apps to download. If you are the developer of this app and would like your information removed, please send a request to takedown@appadvice.com and your information will be removed.