You are using an outdated browser. Please
upgrade your browser to improve your experience.

Simple easy to use statistics program for students of high schools, colleges and universities

SchoolStat
by CereScape Pty Ltd
What is it about?
Simple easy to use statistics program for students of high schools, colleges and universities. Adapted from SchoolStat for Macintosh released originally in 1989.
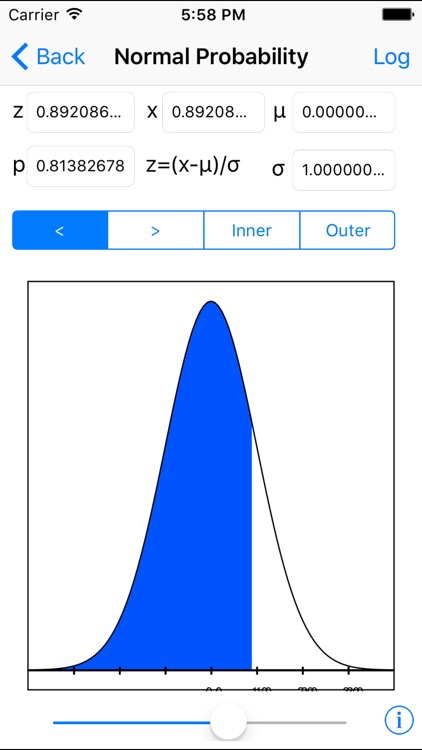
App Screenshots
App Store Description
Simple easy to use statistics program for students of high schools, colleges and universities. Adapted from SchoolStat for Macintosh released originally in 1989.
Aims to facilitate teaching of introductory statistics and to be a useful tool for statistical computations anywhere an iPhone can go.
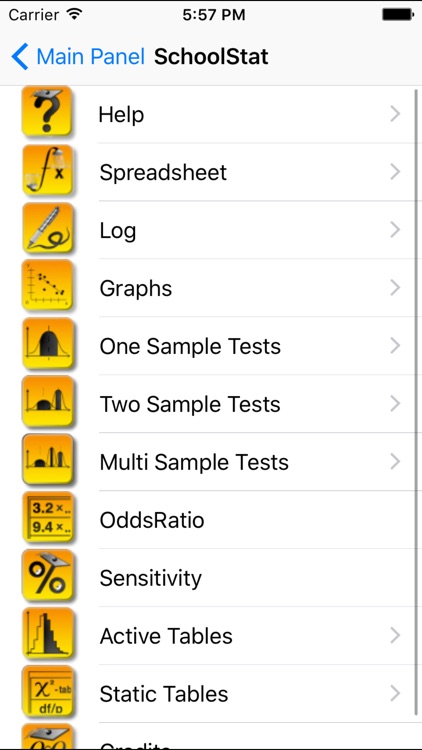
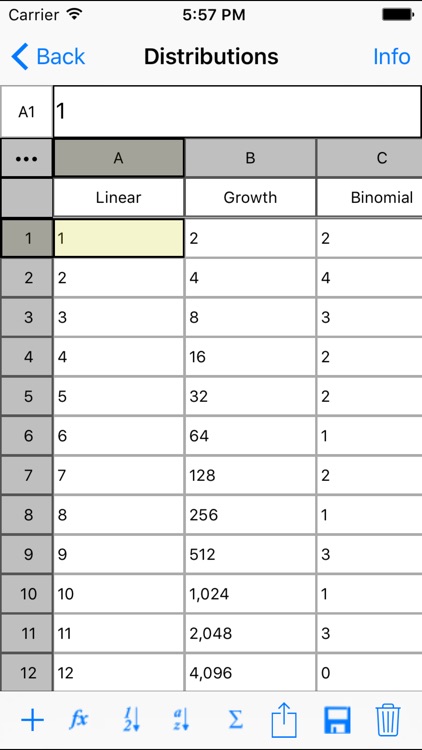
- Enter data into a fully functional spreadsheet with thousands of rows and columns, name the columns and perform statistical computations with results stored in the log panel.
- Spreadsheet includes functions for trigonometry, table & cell access, maths, statistics, strings, logical, date, time, financial and matrix manipulations (>180 in total). Resize cells, zoom and swipe to scroll, file saving/opening and emailing. Series and sorting functions. Quick sum, average, min, max. Intuitive cell editing and selection.
- Spreadsheet also supports cut/copy/paste and shake to undo.
- One, two or multiple sample statistics available for named columns including descriptive, confidence intervals, correlation, linear regression, sign test, Wilcoxon paired test, Paired t-test, Mann-Whitney U test, Student's independent t-test, Kolmogorov-Smirnov test, One-way ANOVA, Kruskal-Wallis test.
- Odds ratio and sensitivity/specificity testing.
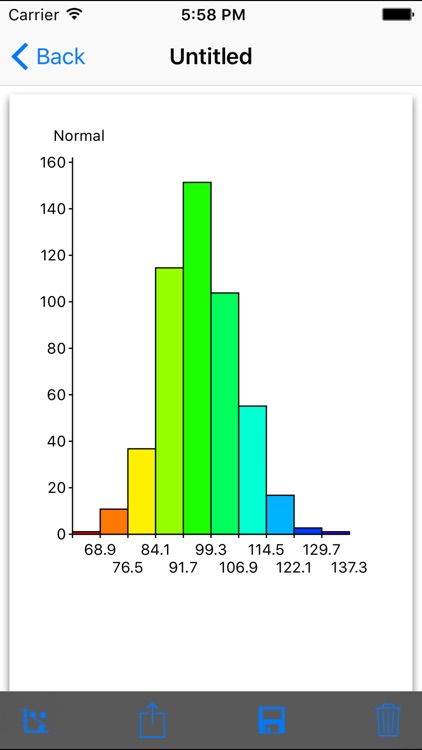
- Create graphical displays using box plots, pie chart, stem & leaf displays, histograms, linear or scatter plots.
- Visualise "active" probability tables for multiple distributions to aid understanding of parameter changes for beta, binomial, Cauchy, chi square, exponential, F-, gamma, geometric, hypergeometric, logistic, lognormal, normal, Poisson, t-, Weibull distributions.
- Static tables available for chi-square, F-, Inverse normal and normal, Kruskal Wallis, Mann-Whitney, T- and Wilcoxon distributions.
- Log window supports annotation, text cut/copy/paste, file saving/opening/emailing, addition of time/date stamp and is automatically saved.
- Graph window creates pdf resolution independent files, which can be copied, and file saving/opening/emailing.
- Full help descriptions for all functions and sample spreadsheet files accompanying quick tutorial.
Disclaimer:
AppAdvice does not own this application and only provides images and links contained in the iTunes Search API, to help our users find the best apps to download. If you are the developer of this app and would like your information removed, please send a request to takedown@appadvice.com and your information will be removed.
AppAdvice does not own this application and only provides images and links contained in the iTunes Search API, to help our users find the best apps to download. If you are the developer of this app and would like your information removed, please send a request to takedown@appadvice.com and your information will be removed.