You are using an outdated browser. Please
upgrade your browser to improve your experience.

### Features of this statistics app ###

Stats tester plus
by Hideki Ono


What is it about?
### Features of this statistics app ###
App Screenshots


App Store Description
### Features of this statistics app ###
1. By using Stats tester plus, you can perform some parametric and nonparametric statistics tests with an easy operation.
2. Since one sample group (multiple data) is entered in one window, it is easy to enter, add, and modify many data.
3. For tests with multiple input windows, 100 data can be entered for each input window. For tests such as chi-square test (2X2, mXn) and Fisher exact test (2X2), you can enter up to frequency of 100,000,000
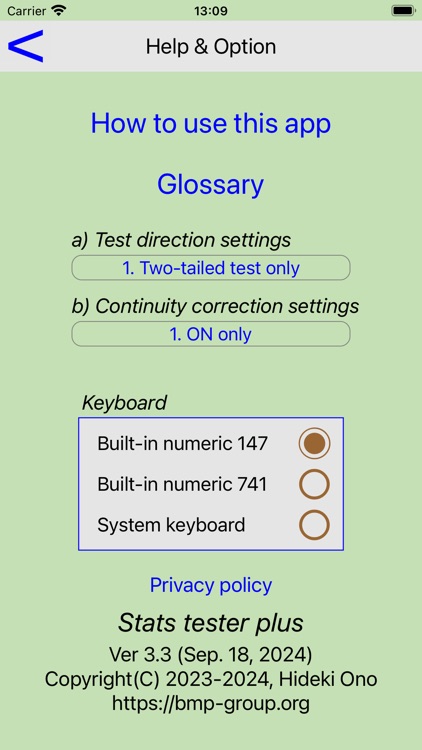
4. A built-in 10-keypad in a phone or calculator layout makes data entry easy. Standard iPhone and Mac keyboards are also available, and these can be switched to a 10-keypad at any time.
5. Unlike the Mini version, Stats tester plus includes tests that allow not only two-tailed tests but also one-tailed tests. In addition, for tests that perform continuity correction, it is also possible to display the test results without continuity correction.
6. Input data and all output screen can be recorded by sharing (mail, memo). No need to take notes on paper.
7. Data can be imported into the input window from apps such as Excel and Numbers by copy/paste, although it takes a little time. When you have an M1~3 Mac, you can simply copy/paste Numbers data into the input window of this app.
8. You can check the usability of this app with Stats tester mini (free version). Stats tester mini has fewer tests than Stats tester plus and does not support one-tailed tests, but its usability is the same as Stats tester plus. Please download Stats tester mini and check the usability of this Plus version of Stats tester.
## how to use ##
Each test screen has [Help], [Example], [Graph], [Calc], [Clear] and [Share] buttons.
You can check the usage details in the free version of Stats tester mini.
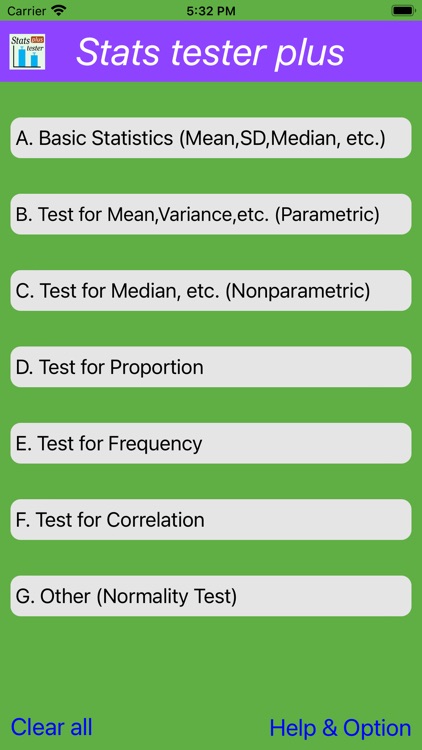
## Statistics methods ##
Currently, 27 methods are available.
A. Basic Statistics (Mean,SD,Median, etc) [Graph]
1. Mean, SD, Skewness, Kurtosis, etc.
( Means (Arithmetic, Geometric and Harmonic), Standard Deviation、Standard Error、Confidence interval (CI, 95 and 99%), Variance, Unbiased variance, Coefficient of variation (%CV), Skewness, Kurtosis)
2. Median, Range, Quartiles and Boxplot [Graph]
(Median, Maximum, Minimum, Quartiles, Quartile Deviation, Boxplot)
B. Test for Mean,Variance,etc. (Parametric)
1. One-Sample t-Test (to Compared Mean) [Graph]
2. Two-Sample t-Test (Student's and Welch's t-Tests) [Graph]
3. Paired t-Test (Paired Sample) [Graph]
4. F-Test of Variance for Two Samples [Graph]
5. Levene Test of Variance for Multiple Samples [Graph]
6. One-Way Analysis of Variance (ANOVA) [Graph]
7. Multiple t-Test with Bonferroni Correction [Graph]
C. Test for Median, etc. (Nonparametric)
1. Mann-Whitney U Test (Two Samples) [Graph]
2. Median Test (Two Samples) [Graph]
3. Wilcoxon Signed Rank Test (Paired Sample) [Graph]
4. Kruskal-Wallis Test & Multiple Comparisons (by Bonferroni Correction) [Graph]
D. Test for Proportion
1. Sign Test (Paired Sample) [Graph]
2. Binomial Test [Exact Method] (One-Sample Proportion Test)
3. Binomial Test [Approx Method] (One-Sample Proportion Test)
4. Two-Sample Proportion Test [Approx. Method]
E. Test for Frequency
1. Chi-Square Test (Goodness of Fit) [Graph]
2. Chi-Square Test (2x2, Independence)
3. Chi-Square Test (mxn, Independence)
4. McNemar's Test (Chi-Square Test for Paired Sample)
5. Fisher's Exact Test (2x2)
F. Test for Correlation
1. Linear Regression and Test for Pearson Correlation Coefficient [Graph]
2. Test for Differences in Correlation Coefficients (One Sample)
3. Test for Differences in Correlation Coefficients (Two Samples)
4. Spearman Rank Correlation Test [Graph]
G. Other (Normality Test)
1. Shapiro-Wilk Test (Normality) and Q-Q Plot [Graph]
Disclaimer:
AppAdvice does not own this application and only provides images and links contained in the iTunes Search API, to help our users find the best apps to download. If you are the developer of this app and would like your information removed, please send a request to takedown@appadvice.com and your information will be removed.
AppAdvice does not own this application and only provides images and links contained in the iTunes Search API, to help our users find the best apps to download. If you are the developer of this app and would like your information removed, please send a request to takedown@appadvice.com and your information will be removed.