You are using an outdated browser. Please upgrade your browser to improve your experience.

Statistical Analysis Made Easy With These Awesome Calculators

This amazing list of apps offers clean interfaces and algorithms designed to facilitate statistical analyses. If you're looking to compare two groups of data, calculate sample size/power, computing Six Sigma values, or calculating p values for hypothesis tests, these apps are for you.

Power Analysis
StarStat
Stats Calculator - Statistics Formulas
Quick Confidence Interval
Biostats Buddy

Best Apps

Highest scored apps in the category

Power Analysis
Power Analysis

Power Analysis

A&X Analytics, LLC

Design experiments and measurements confidently with minimal knowledge of statistics

Design experiments and measurements confidently with minimal knowledge of statistics.

Have you ever worried if the study you were planning would have enough data to conclude anything?

Know how much data you need while you're still in the planning phase. Let the app do the statistics for you.

• Easy to use interface helps you enter the pertinent information without being a statistics...

StarStat
StarStat

StarStat

DataStar, Inc.

StarStat is a free statistical calculator designed to easily perform tests of statistical significance on your survey data

StarStat is a free statistical calculator designed to easily perform tests of statistical significance on your survey data.

Survey researchers use significance testing as an aid in expressing the reliability of survey results. Phrases such as "significantly different," "margin of error," and "confidence levels" help describe and make comparisons when analyzing data.

The purpose of this free tool is to...

Statistics Calculator--

Statistics Calculator

Dogahe

Statistics Calculator-- is an introductory app for our flagship Statistics Calculator++, a calculator with great advanced scientific features as well as statistical, regression analysis, probability distributions, confidence intervals, and hypothesis tests capabilities

Statistics Calculator-- is an introductory app for our flagship Statistics Calculator++, a calculator with great advanced scientific features as well as statistical, regression analysis, probability distributions, confidence intervals, and hypothesis tests capabilities. 

Statistics Calculator-- will have all the functionality of Statistics Calculator++ by purchasing a single In-App Purchase.

The purchase will remove the limit on the size of the lists, unlocks...

Stats Calculator - Statistics Formulas

Stats Calculator

Kamal Nasir

This Statistical Calculator performs the following

This Statistical Calculator performs the following.

1. Arithmetic, Geometric and Harmonic Mean,
2. Arithmetic, Geometric and Harmonic Mean Group Data,
3. Median, Mode and Range,
4. Standard Deviation and Variance,
5. Standard Deviation and Variance Population,
6. Root Mean Square/ Quadratic Mean,
7. Correlation Co-efficient,
8. Simple/Linear Regression,
9. Standard Error Of The Mean,
10. Coefficient Of Variance,
11. Weighted Mean,
12. Bayesian Analysis Calculations,
13. Absolute Percentage Error,
14. Skewness,
15. T Test,
16. F...

Quick Confidence Interval

Quick Confidence Interval

MSYapps

In statistics, confidence intervals can be used to express the degree to which sample results are reliable

In statistics, confidence intervals can be used to express the degree to which sample results are reliable.

Confidence intervals are often stated in terms of a percentage like 90% or 95%. When the sample or population distribution is the Normal (bell-shaped) distribution, the confidence intervals can be represented as a number of standard deviations (σ) above or below the sample mean...

Biostats Buddy
Biostats Buddy

Biostats Buddy

California State University, Northridge

Use Biostats Buddy to help in the calculation of common procedures used in biostatistics

Use Biostats Buddy to help in the calculation of common procedures used in biostatistics. Formulas and variable descriptions are included to assist with the process of calculations and to aid in retention of material.

Biostats Buddy can be used to calculate:

Z-scores
One sample z tests
One sample t tests
Two related sample t tests

User-friendly design makes it easy to enter calculation components...

F-Distribution Function

F-Distribution Function

Donald Schaefer

In probability theory and statistics, the F-distribution is a continuous probability distribution

In probability theory and statistics, the F-distribution is a continuous probability distribution.

The F-Distribution Function Calculator calculates the F-Distribution Cumulative Probability associated with a f value and two Degrees of Freedom.

The F-Distribution Function Calculator also displays a graph for the generated F(x) values from the x random variable and the df(1) and df(2) Degrees of Freedom input variables and displays a...

Statistics Calculator++

Statistics Calculator++

Dogahe

Simplify your statistics with Statistics Calculator++

Simplify your statistics with Statistics Calculator++
Perform powerful statistical analysis without needing a manual. Enter your data easily using "Add X," "Add Y," and "Add Z" buttons, and let Statistics Calculator++ handle the rest. Analyze results in a clear table, including sum, mean, standard deviation, quartiles, and more. Visualize your data with box and whisker plots and histograms.

Powerful regression analysis:
Choose from...

tValue
tValue

tValue

David Bourne

tValue can be used to quickly calculate unpaired Student t Values given two sets of mean, standard deviation and n

tValue can be used to quickly calculate unpaired Student t Values given two sets of mean, standard deviation and n. t values for difference from zero or other specified value can be calculated. Use the difference values for Set 1 and leave Set 2 blank for a paired t test.

Also Good

Apps with average score

Statistics Calculator+++

Statistics Calculator+++

Dogahe

Statistics Calculator+++ is a scientific calculator with statistical, regression analysis, probability distributions, confidence intervals, and hypothesis tests capabilities.

In designing the statistics functions of this app we had one thing in mind: The user should not need to read a single line of manual to perform the statistical analysis....

Statistical Calculator

Statistical Calculator

iFahja

Statistical Calculator can be used both as a Calculator as well as a Statistics guide.

As a Calculator:
This app is extremely useful for your quantitative statistical problems/calculations. It provides handy calculations for:
-> Arithmetic Mean of Raw Data.
-> Arithmetic Mean of Grouped Data
-> Geometric Mean of Raw Data.
-> Geometric Mean of...

Simple Stat - Calculator for Statistics Students

Simple Stat - Calculator for Statistics Students

Enrico Susatyo

Simple Stat is an application that can perform statistics tests which are commonly used in first year university statistics course. Simple Stat is very easy to use, and suits first year statistics students very well.

The statistics tests that are included in Simple Stat are:
- Z-test for mean
- Z-test for proportion
-...

Quick Bootstrap Statistics

Quick Bootstrap Statistics

MSYapps

Bootstrapping is a technique for measuring sample statistics from a relatively small set of data elements. By randomly resampling with replacement from the array of data elements, the software is able to generate a distribution that approximates the Normal Distribution from which parametric statistics like mean, standard deviation, skewness, and...

Statistics Calculator Lite

Statistics Calculator Lite

KBIC International Ltd

In basic statistics, students are required to calculate different statistical measures of a set of numbers. With this app, the following statistical measures will be made available to you after you enter a set of numbers:

- Number of terms
- Total sum
- Mean (Average)
- Mode
- Median
- Range
- Population Standard Deviation (SD)
-...

Statistics Calculator

Statistics Calculator

KBIC International Ltd

In basic statistics, students are required to calculate different statistical measures of a set of numbers. With this app, the following statistical measures will be made available to you after you enter a set of numbers:

- Number of terms
- Total sum
- Mean (Average)
- Mode
- Median
- Range
- Population Standard Deviation (SD)
-...

Standard Deviation Calculator

Standard Deviation Calculator

Keely Hill

Use this app to calculate the standard deviation of a set of values.

It will also return the:
-mean(average)
-variance
-population deviation
-Median
-Q1 & Q3

To add a value to the set press "+Row". When all data are in press "Calculate".
Note: Population deviation (n-1) is unbiased, while normal standard deviation (n) is biased.

To calulate the...

Statistical Process Control

Statistical Process Control

Fernando Haro Martinez

Statistical Process Control is a statistical tool of Statistical Quality Control. Control Charts aid the Six Sigma professional in the process of determining if a process is under control.

All you need to do is to enter numbers separated by spaces and see the results immediately.

List of features:

- X-Bar Chart
- Range...

Talking Statistics Calculator

Talking Statistics Calculator

Adam Croser

Designed for a wide range of users, this statistics calculator has large colorful buttons, optional high contrast, full VoiceOver support, and unique to this statistics calculator; the option to hear numbers spoken in natural voice. This is a great companion to the Talking Scientific Calculator which has become a favorite...

Average Calculator
Average Calculator
Average Calculator

Average Calculator

Piet Jonas

Calculates the arithmetic mean, the geometric mean and the harmonic mean as well as the standard deviation and the confidence interval of a set of numbers.

The calculator results can be emailed.

Binomial Distribution

Binomial Distribution

Donald Schaefer

In probability and statistics, The Binomial Distribution is a frequency distribution of the possible number of successful outcomes in a given number of trials in each of which there is the same probability of success.

The Binomial Distribution summarizes the likelihood that a value will take one of two independent values...

Statistics Calc.
Statistics Calc.
Statistics Calc.

Statistics Calc.

Urihel Lopez Barrera

Mean, median, mode, variance, standard deviation, linear and nonlinear regressions, interpolations, probability distributions, combinations, permutations ... more than 30 statistical & probability calculations, all in the same app.

Descriptive Statistics

Descriptive Statistics

Fernando Haro Martinez

Basic and useful statistics, focused in the most popular statistics used for Quality Engineers and Scientists.
Descriptive statistics was developed with the aim to be the introduction of a most complete selection of statistics tools for Six Sigma Engineers.

Abu-Bader Sample Size

Abu-Bader Sample Size

yaniv yyassour

Abu-Bader Sample Size App helps users to determine the minimum sample size required for the most utilized bivariate and advanced statistics (Pearson’s correlation, Student’s t-tests, ANOVA, ANCOVA, Chi-Square tests, and Multiple Regression Analysis) in order to achieve a statistical power of .80 given a number of requirements. The App describes...

Lean Six Sigma Calculator

Lean Six Sigma Calculator

Leo, Chan C H

The Lean Six Sigma Calculator is developed with consultancy advices from an experienced Lean Six Sigma professional who has been deploying the methodology for more than 15 years in the financial services industry, providing strategic quality planning, training and project facilitation to management, black belts and green belts from general...

Vannan Statistics Play

Vannan Statistics Play

Anton Arulvannan Sathyaseelan

This is a Statistics Calculator

In three ways you can input
i)
2,3,2,4,2,5,23,44,2,44,55,3,3,5,5,33,55,35,3,55,3
ii)
0-10*10,11-20*2,21-30*6,31-40*4,41-50*5
iii)
2,3,2,4,2,5,23,44,2,44,55,3,3,5,5,33,55,35,3,55,3
and Enter range separately
like 0-10,11-20,21-30,31-40,41-50

OR

In three ways you can input
i)
2 3 2 4 2 5 23 44 2 44 55 3 3 5 5 33 55 35 3 55 3
ii)
0-10*10 11-20*2 21-30*6 31-40*4 41-50*5
iii)
2 3 2...

Poisson Distribution Calc

Poisson Distribution Calc

Donald Schaefer

In probability theory and statistics, the Poisson distribution is a discrete probability distribution that expresses the probability of a given number of events occurring in a fixed interval of time and/or space if these events occur with a known average rate and independently of the time since the last event....

Stats Aide
Stats Aide
Stats Aide

Stats Aide

Darren Gates

Common calculators for students of math, statistics, science, and engineering (especially first year statistics), including:

Bayesian Analysis
Binomial Distribution
Arithmetic & Geometric Mean
Coefficient of Variance
Correlation Coefficient
Factorial
Grouped Data Arithmetic Mean
Harmonic Mean
Hypergeometric Distribution
Mean, Median, Mode
Negative Binomial Distribution
Normal Distribution
Percent error
Permutation and Combination
Poisson Distribution
Probability
Regression
Root Mean Square
Skewness
Standard Deviation
Standard Error
T-Test Calculator
Weighted Mean

WhatStat
WhatStat
WhatStat

WhatStat

everywhereIM

WhatStat is a statistical calculator developed by the MSc Epidemiology, Graduate School of Life Sciences, Utrecht University. It contains various tools for Sample Size Determination and for performing other useful epidemiological calculations.

ScreeningTest
ScreeningTest
ScreeningTest

ScreeningTest

Yasunari Miyagi, MD

A tool of statistics. Designed for scientist, doctors, teachers, students,etc.
Calculated results are as follows;
Chi-square test with Fisher's exact test,
sensitivity,
specificity,
effectiveness,
false positive,
false negative,
positive predictive value,
negative predictive value,
prevalence rate,
odds ratio,
relative risk,
likelihood ratio for a positive finding (LR+),
likelihood ratio for a negative...

Statistical Calculator HD

Statistical Calculator HD

iFahja

Statistical Calculator HD can be used both as a Calculator as well as a Statistics guide.

As a Calculator:
This app is extremely useful for your quantitative statistical problems/calculations. It provides handy calculations for:
->Arithmetic Mean of Raw Data.
->Arithmetic Mean of Grouped Data
->Geometric Mean of Raw Data.
->Geometric...

Other Apps

Could be good for special cases

XbarRChart

XbarRChart

APPSKOUSIKA SOTWARE DEVELOPERS (OPC) PRIVATE LIMITED

Xbar and R chart are used to check whether the given process is under Control.These charts are used as tools of SPC(Statistical Process Control).
Each subgroup need to have two or more measurements/readings but less than or equal to nine measurements.Two or more subgroups but preferably less than or equal to twenty subgroups are needed.
First, name the Process and enter number of measurements per subgroup(n),and enter number of subgroups(k).
Then enter measurements/readings separated by comma(,) and enter subgroups separated by semicolon(;).
Example 2.01,2;2.01,2.01;2.013,2.01;2.0,1.99;1.99,2.01;2.01,2.0;2,1.99;1.98,2.0;2,1.99;2.01,2;2.01,2.01;2.013,2.01;2.0,1.99;1.99,2.01;2.01,2.0;2,1.99;1.98,2.0;2,1.99;2.0,1.99;1.99,2.01

As a first step make R Chart.If you find the R chart to be valid (within limits),close the chart and make x bar chart.The following points on x bar chart indicates out of control(SPC) process:

a. one point outside the 3 sigma control limits
b. eight successive points on the same side of the centerline
c. six successive points that increase or decrease
d. two out of three points that are on the same side of the centerline,
both at a distance exceeding 2 sigma’s from the centerline
e. four out of five points that are on the same side of the centerline,
four at a distance exceeding 1 sigma from the centerline

As you make the R chart the details are saved.You can open Sample group List(Menu > sample group list) to find the saved details and charts.You can share the charts(print/email).Menu > New Sample Group enables you to make new charts.

UnpairedT

UnpairedT

Yasunari Miyagi, MD

A tool of statistics for scientists, doctors, researchers, students, etc.
This App handles unpaired t-test and Welch's t-test, that are automatically selected by variance comparison test. The confidence intervals of the difference of two averages are also provided.

This is a useful test for the comparison of mean for two independent groups.
At first, the variance (=standard deviation^2 = SD^2) of the data are tested. If the variance of the groups are not different, t-test (Student t-test) is applied automatically. If different, Welch's t-test is applied. When P value is less than 0.05, the averages of two groups are different. When P value is equal or more than 0.05, the averages are not different. If you like to know the confidence intervals of the mean difference, adjust the control bar. By default, variance criteria = 0.1, confidence interval=0.95. The total number of elements should not be over 500.

Spread Calculator

Spread Calculator

Essence Computing

Do you need to know not only what the standard deviation, the spread and the range of a sequence of numbers are but also how to calculate them? If so then this App is for you. Not only will this App tell you the answer but it will also tell you how you can work it out for yourself using the information you have provided. Great for helping children trying to understand these concepts and for reminding yourself about them.

Just select the field at the top of the screen and a keypad will be shown. You type in the numbers in the sequence separating them using the space key (the empty key at the bottom left). When you have added all the numbers press the OK button. The keypad disappears and the answers are presented below in the table. On the iPhone there is another button at the top that leads to a page that explains how each of the averages was calculated. On the iPad the table to the right has the explanations.

The App calculates the Range, the lower quartile value, the upper quartile value, the interquartile range, and the standard deviation. It also explains how to calculate each of these values and in the case of the standard deviation shows you to different methods for calculating it.

BellCurve: Normal Distribution Calculator (FREE)

BellCurve: Normal Distribution Calculator (FREE)

Max Buot

** Non-ad version available for purchase ($0.99) **

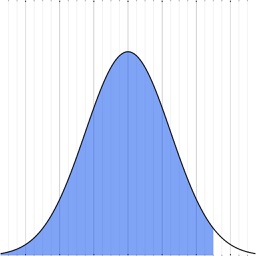
The normal curve is used in many statistical calculations. BellCurve is an easy to use calculator that finds probabilities in a normal distribution.

BellCurve consists on two views. The main view displays the normal curve, with probability of interest shaded in. Lower and upper bounds can be changed using the slider. The flipside view allows users to specify exactly the expected value (mu), the standard deviation (sigma), the lower bound (green dot) and the upper bound (red dot). Z scores are also shown.